
Table of contents
Municipal Sector Outlook

Our mid-year 2026 Municipal Sector Outlook highlights a shifting landscape for municipal credit. Significant federal policy changes, evolving sector fundamentals and persistent macroeconomic uncertainties are reshaping sector characteristics.
Key Takeaways
- Overall, the outlook across sectors remains constructive. However, rising legislative risk and funding pressures are likely to drive greater differentiation in credit performance.
- As reductions in Medicaid funding take hold, hospitals and state budgets face meaningful implications.
- Demographic headwinds and financial pressure are contributing to a growing dispersion in higher education, as smaller institutions are increasingly challenged.
- In transportation and utilities, fundamentals remain broadly stable, but policy uncertainty, capital investment needs and demand shifts—particularly from data centers—are reshaping long-term risk profiles.
Hospitals
The 2025 One Big Beautiful Bill Act (OBBBA) stipulated significant structural changes to federal Medicaid funding. The Congressional Budget Office projected a $911 billion to $1.02 trillion reduction in federal Medicaid outlays from 2025 through 2034. However, the legislation was heavily backloaded, delaying severe budget pressures primarily beyond 2027. The timetable should give hospitals time to adapt. Therefore, we do not have a more negative sector outlook at this point.
Implementation Timeline
- States must update technology, budgets and compliance systems, with only 6% of the total cuts taking effect from 2025 to 2027 (ramp-up).
- Temporary federal matching incentives for expansion states ended, and emergency Medicaid matching for certain non-citizens was rolled back in January 2026.1
- The 80-hour monthly work or community engagement requirement takes effect for Medicaid expansion adults ages 19 to 64 in January 2027.
- From 2028 to 2034, the remaining 76% of funding reductions take effect, increasing pressure on states to fund programs from general revenues, reduce optional benefits or narrow provider networks (“the cliff”).
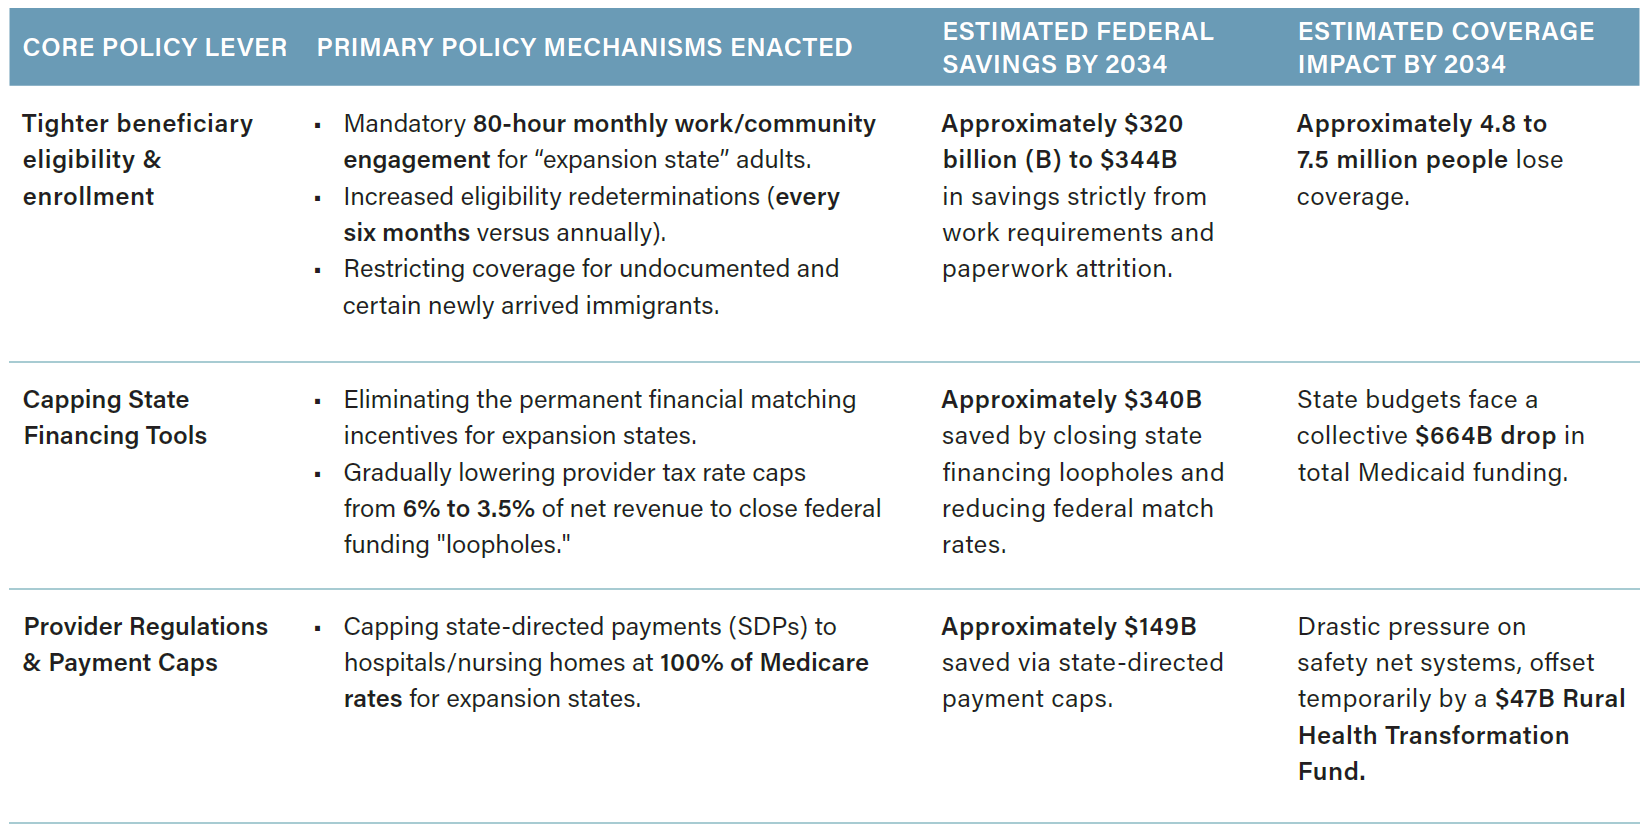
As seen in the following table, three core policy levers will pressure Medicaid:
Federal Medicaid Budget Reductions Under OBBBA
Higher Education
Demographic headwinds, rising cost pressures and disruptions to traditional federal funding models are creating a more challenging operating environment for higher education issuers. We have a moderately deteriorating outlook for the higher education sector.
- Increasingly, large, well-capitalized and highly selective institutions continue to gain market share relative to schools without a strong niche or brand, which has resulted in significant demand dispersion.
- Demand pressure appears structural rather than cyclical, with demographic challenges particularly acute for smaller regional schools.
- Revenue growth remains constrained, while expense pressures continue to build. Contributing factors include the 2025 peak in graduating US high school students and a decline in applications from international students resulting from federal policy shifts and increased global competition.
- For public institutions, state support has been favorable, but rising costs could force budget tradeoffs, and higher education is often an early target for reductions.
Negative regional growth rates
Projected percent change in high school graduates, 2023 to 2041
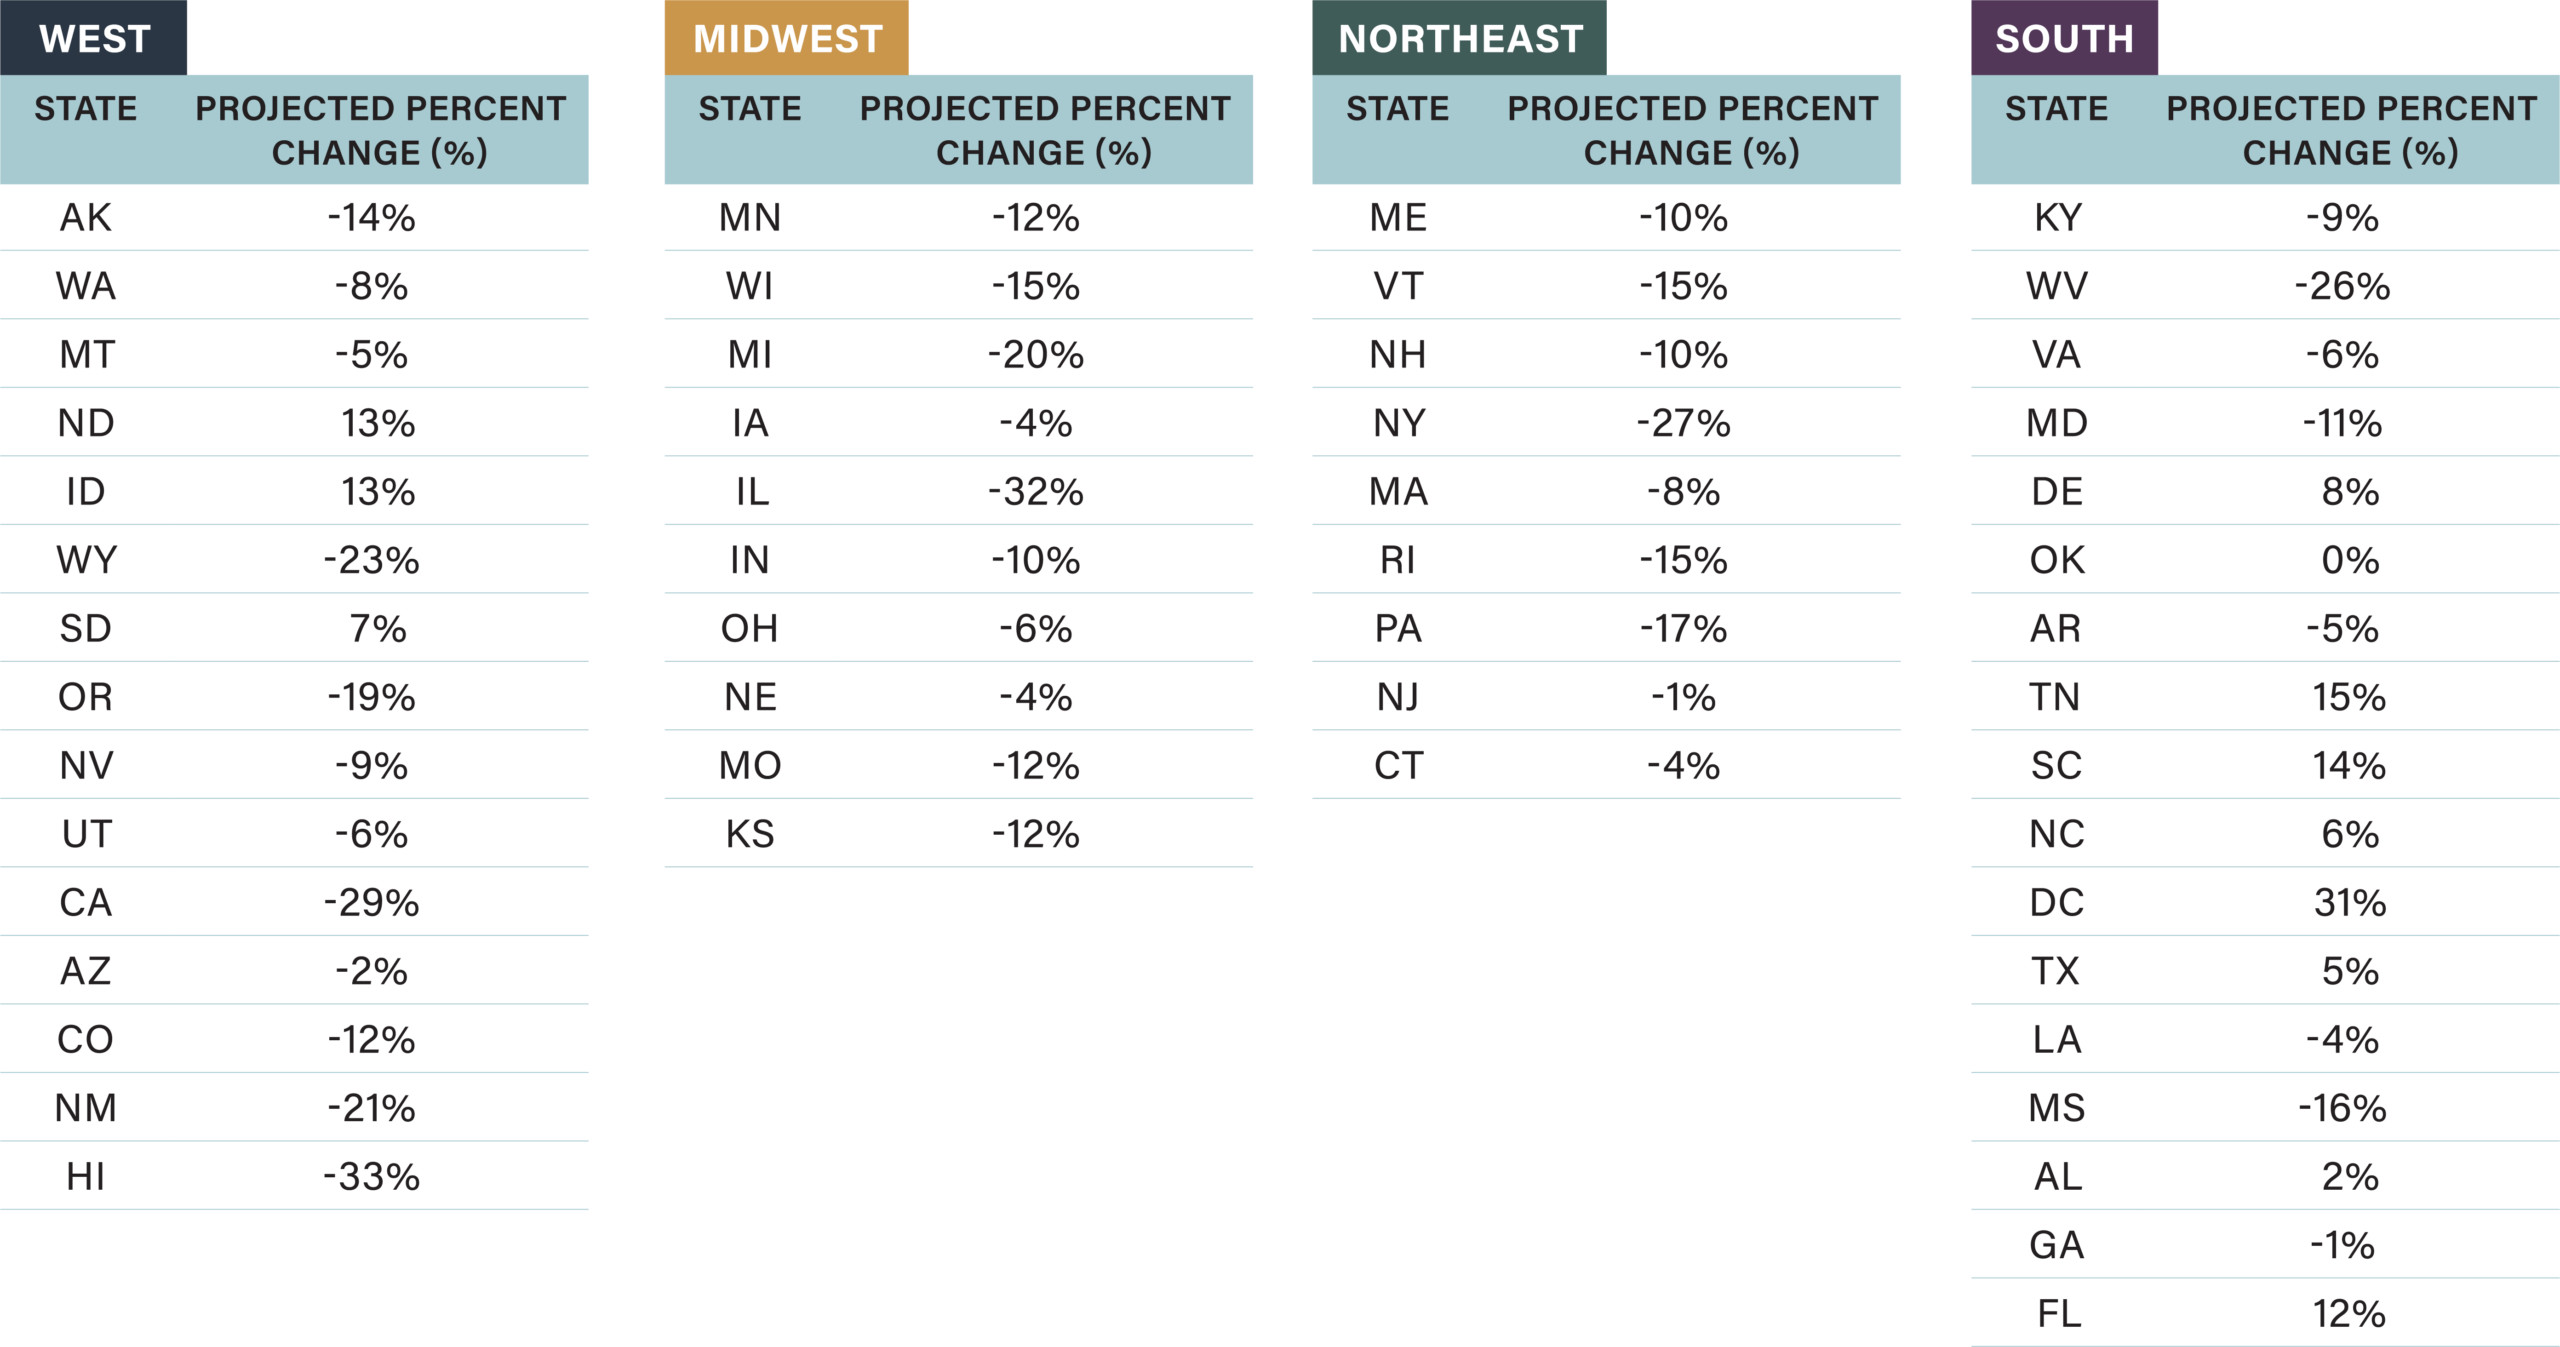
Source: Western Interstate Commission for Higher Education, as of December 30, 2024. The graphic presented above is shown for illustrative purposes only. Some or all of the information shown may be dated, and, therefore, should not be the basis to purchase or sell any securities.
Transportation (Airports, Ports and Toll Roads)
Air travel demand remains strong and overall credit quality solid. This is despite elevated uncertainty stemming from war risk, fuel prices, consumer sentiment and the relative attractiveness of the US as a destination. We have a neutral outlook for the transportation sector including for each of the three sub-components (airports, ports and toll roads).
Unlike the airline sector, airports share some inherent credit strengths that serve to cushion against macro developments.
- Airports typically benefit from meaningful barriers to entry and some degree of monopoly power.
- Airports resemble diversified landlords, supported by multiple tenants and revenue streams.
- In our view, liquidity remains healthy at roughly 700 days cash on hand. Debt service coverage of about 3.0X continues to support balance sheet strength. Debt to earnings before interest, taxes, depreciation and amortization (EBITDA) of 3.9X remains well below the 20-year average of 5.6X.
- The macro backdrop for ports remains constructive, with tariff-related risks appearing more balanced between upside and downside scenarios.
- Looking at toll roads, the current five-year highway funding authorization expires in September 2026, creating uncertainty for the sector. While reduced federal grants could increase pressure to leverage operating revenues, we do not foresee this happening.
- The Department of Transportation has proposed eliminating the Mass Transit Account of the Federal Highway Trust Fund and limiting the use of highway funds for public transit. A more sustainably funded Highway Account could reduce the need to leverage toll revenues. Meaningful policy change is unlikely before the midterm elections.
Air travel has recovered to a narrow range
Daily Transportation Security Administration Checkpoint Travelers – 7-Day Moving Average
(January 7, 2025, to June 1, 2026)
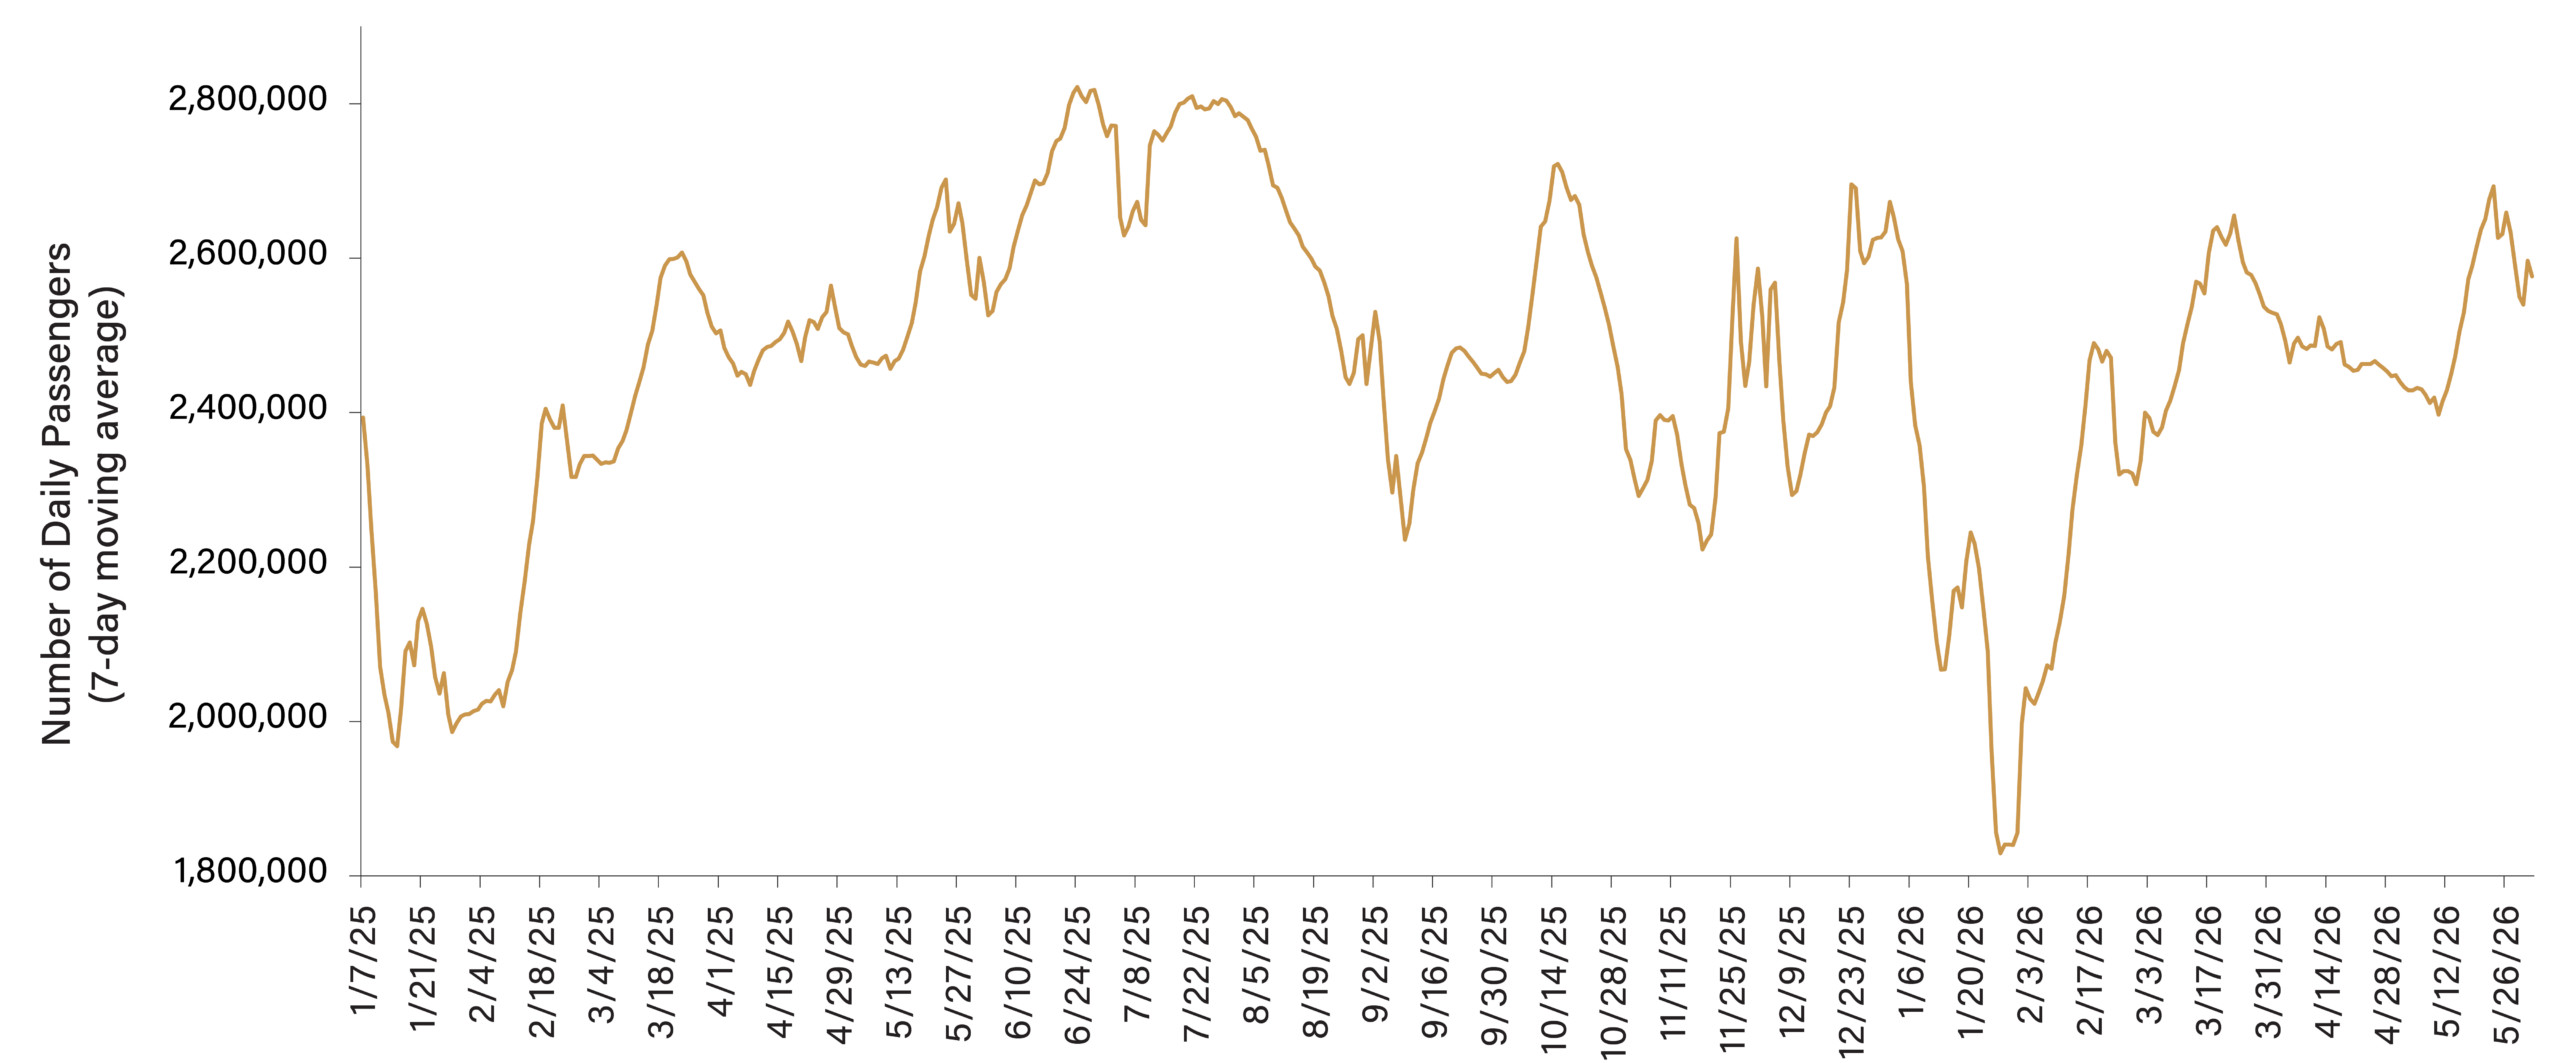
Source: Loomis Sayles, Transportation Security Administration, as of June 1, 2026.
Electric Utilities
In our view, sector fundamentals remain supported by constructive cost recovery frameworks, including rate policies linked to capital spending needs, automatic adjustment mechanisms and a generally stable ratepayer base.
- Municipal utilities continue to prioritize affordability for residential customers as they negotiate with large-load users such as data centers. Management teams are generally approaching these contracts prudently, favoring long contract terms, minimum annual payments and rate structures that shift incremental cost burdens toward large-load customers.
- As local concerns about data center development grow and equipment backlogs extend generation timelines to roughly three to five years, some corporate users may increasingly pursue a bring-your-own-power model. Utilities with the ability to build and connect new capacity are likely to continue leveraging up to meet demand, supported in part by the revenue stability of large-load customers and disciplined efforts to avoid stranded asset risk.
- Utilities with stronger balance sheets and more competitive rates have also expanded rate stabilization funds to mitigate future affordability pressure. According to S&P Global, there is currently no observable correlation between five-year growth in data center power demand and residential rates, although that could become more challenging as wholesale power market/grid operators move closer to capacity limits.
Members of the Large Public Power Council (LPPC) include 29 of the nation’s largest not-for-profit public power utilities across 23 states. Its forecast is for more than $166 billion of capital needs over the next decade, spanning distribution, transmission and new generation capacity, which is up from $97 billion in the prior decade.
LPPC Member Capital Requirements
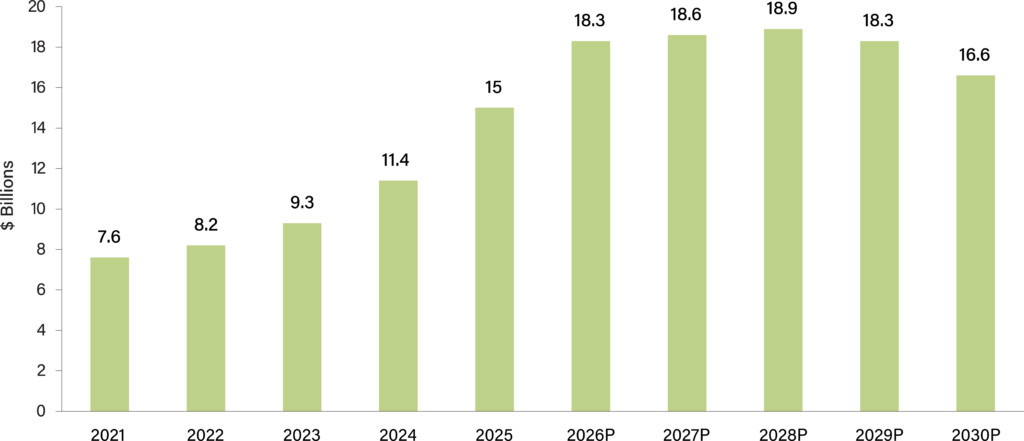
Source: Large Public Power Council, as of March 31, 2026. CAPEX: capital expenditure. Projected data 2026 through 2030.
States
The macroeconomic backdrop for states remains broadly constructive.
- With the US being a major net exporter of petroleum and refined fuels, higher oil prices positively impact GDP (gross domestic product) while promoting further investment in energy infrastructure. Therefore, a higher-for-longer oil environment could potentially be a net positive for the national economy and particularly supportive for energy-producing states and employment opportunities in the energy sector.
- University of Michigan consumer sentiment remains near historical lows, potentially reflecting elevated gasoline prices. As of June 30, 2026, the correlation between the two was negative 0.60.
- Fiscal policy remains supportive.
Conclusion
Overall, municipal credit fundamentals remain broadly resilient, but the operating environment is becoming increasingly complex as federal policy shifts and sector-specific pressures take hold. Healthcare and state credits face the most pronounced headwinds as Medicaid funding dynamics evolve, while we expect dispersion in higher education and transportation to widen. At the same time, the utilities and infrastructure sectors continue to benefit from structural strengths, though capital intensity and demand shifts will require careful credit selection. In this environment, we believe a disciplined, research-driven approach will be critical to identifying relative value as credit differentiation becomes a more dominant driver of performance.
Endnote
1 Medicaid.gov: “A State is an expansion State if, on March 23, 2010, the State offered health benefits coverage Statewide to parents and non-pregnant, childless adults whose income is at least 100 percent of the poverty line, that includes inpatient hospital services, is not dependent on access to employer coverage, employer contribution, or employment and is not limited to premium assistance, hospital-only benefits, a high deductible health plan, or alternative benefits under a demonstration program authorized under section 1938 of the act.”
Disclosure
The S&P 500® Index is a widely recognized measure of US stock market performance. It is an unmanaged index of 500 common stocks chosen for market size, liquidity, and industry group representation, among other factors. It also measures the performance of the large-cap segment of the US equities market.
Some or all of the information on the charts may be dated, and, therefore, should not be the basis to purchase or sell any securities. The information is not intended to represent any actual portfolio. Information obtained from outside sources is believed to be correct, but Loomis Sayles cannot guarantee its accuracy. This material cannot be copied, reproduced or redistributed without authorization.
Past performance is no guarantee of future results.
Market conditions are extremely fluid and change frequently.
Any investment that has the possibility for profits also as the possibility of losses, including the loss of principal.
This marketing communication is provided for informational purposes only and should not be construed as investment advice. Any opinions or forecasts contained herein, reflect the subjective judgments and assumptions of the authors only, and do not necessarily reflect the views of Loomis, Sayles & Company, L.P. Investment recommendations may be inconsistent with these opinions. There is no assurance that developments will transpire as forecasted and actual results will be different. Data and analysis does not represent the actual, or expected future performance of any investment product. Information, including that obtained from outside sources, is believed to be correct, but we cannot guarantee its accuracy. This information is subject to change at any time without notice.
KEY RISKS: Inflation Risk, Fixed Income Risk, Systemic Risk, Currency Risk, and Market Risk.
9035944.1.1
Author
