Municipal Market Update

3rd Quarter 2026
Economy & Rates
- US Treasury interest rates moved sharply higher during the third quarter, with increases broadly distributed across the yield curve. During the quarter, the 2-year yield rose 72 basis points (bps) and the 10-year yield 81 bps. The 10-year yield finished the quarter at 5.28% after beginning the year at 4.17%, an increase of 112 bps. The 10-year reached its highest level since mid-2007, and the 30-year Treasury yield hit its highest level since 2002. This dynamic reflected continued economic strength, persistent inflation readings, and the inflationary impact of the Iran conflict. Little progress was made in US-Iran talks aimed at ending the conflict and fully reopening the Strait of Hormuz, keeping upward pressure on oil prices. Concerns about large fiscal deficits and heavy capital demand, including AI-related investment, added to the pressure.
- Following Federal Reserve Chairman Kevin Warsh’s hawkish Jackson Hole remarks in late August, the Federal Open Market Committee (FOMC) voted in September to raise the federal funds rate by a quarter point to a target range of 3.75%–4%, the first rate hike since July 2023. Warsh characterized the move as removing accommodation rather than tightening and expressed a desire to accelerate the movement of the inflation rate downward toward the Fed’s 2% target. Markets are now pricing in nearly one percentage point of Fed rate increases over the next 12 months.
- The Treasury yield curve remains positively sloped, with front-end yields driven by an increasingly hawkish Fed and longer-term yields influenced by persistent inflation expectations and fiscal considerations. The 2-year/10-year spread steepened modestly in the third quarter, from around 30 bps to around 40 bps at quarter end. The front end repriced for an active tightening cycle, while longer tenors rose even more as investors demanded greater compensation for inflation and supply risks.
- The outlook for the US economy, in our view, remains constructive, although higher borrowing costs are a growing headwind. We expect positive GDP growth of approximately 2%. Growth is being driven by resilient consumer spending, solid corporate investment (including AI-related capital expenditures), and supportive fiscal programs.
- As of 9/12/2026, Loomis Sayles’ Macro Strategies team currently assigns a 55% probability to a “Expansion Resilient” macro scenario as their base case, which forecasts that growth is likely to persist due to supportive fiscal programs, artificial intelligence productivity gains, strong corporate earnings growth, and a stable labor market. “Economic Boom” (marked by a more resilient economic growth trend, an upward bias to yields, and Fed rate hikes continuing into 2027) is assigned a 35% likelihood, and “Growth Scare” (a low GDP growth environment marked by a pullback in consumer spending, cooling S&P 500 earnings growth, and a more accommodative Fed) is assigned a 10% likelihood.
Municipal Market Performance
- Unlike the second quarter, municipal (muni) yields moved higher alongside Treasurys in the third quarter. The selloff built through July and August and intensified after the Fed’s September rate hike, with the front end hit hardest late in the quarter. For the quarter, yields rose approximately 119 bps at the 5-year, 124 at the 10-year, and 112 at the 30-year tenors. The 10-year muni yield topped 4%, its highest level in more than 15years, and the 30-year topped 5%. The net effect is a meaningfully higher yield curve than at the beginning of the quarter.
- In Q3, munis followed Treasurys in the selloff and actually fared worse than Treasurys across most tenors. Several factors likely contributed. The technical support that aided munis in Q2 faded as seasonal summer reinvestment demand passed. Heavy issuance, tax-loss selling, and late-quarter fading investor flows weighed on the market.
- Municipal bond credit spreads were mixed in the third quarter, with spreads tightening longer on the curve while widening modestly on the front end.
- Relative value of munis has improved as a result of the selloff, with municipal/Treasury ratios achieving new 12 month highs just before quarter end.
- The net effect of the yield curve rising, softer technicals, and mixed spread movements was a negative return for the Bloomberg Municipal Bond Index of –6.35% in Q3. Most of the damage came in September. The Index fell -4.36% for the month and was down –4.18% year-to-date when the quarter ended. Losses were largest at the long end, where duration is greatest, with more muted declines around the 3-year and 5-year marks. The silver lining is that higher starting yields now offer substantially more embedded carry going forward.

Source: Bloomberg
Returns for multi-year periods are annualized.
Past market performance is no guarantee of future results.
- From a credit quality perspective, the highest rated investment grade AAA tax-exempt munis were the best performing segment, but only somewhat outperformed AA and lower-rated categories. Similarly, there was not a large performance dispersion between revenue backed bonds and General Obligation bonds.
- All sectors of the investment grade tax-exempt muni market posted negative returns for the quarter. Among our focus sectors, electric power fared the best returning –5.93% in Q3, whereas hospitals posted a relatively weaker return of –7.41%.
- At the end of the third quarter, the muni curve maintained a generally normal, upward-sloping shape, aside from a bit of a “hook” inside of six months where yields were elevated in correlation with the Fed funds rate. The curve steepened a bit in the 10-15 year tenors in Q3, and AAA-rated bonds on the long end of the curve now offer 5%+ tax-exempt yields. We continue to be drawn to the carry and rolldown opportunities on the longer end, as well as selective credit spread exposure among financially stable issuers.
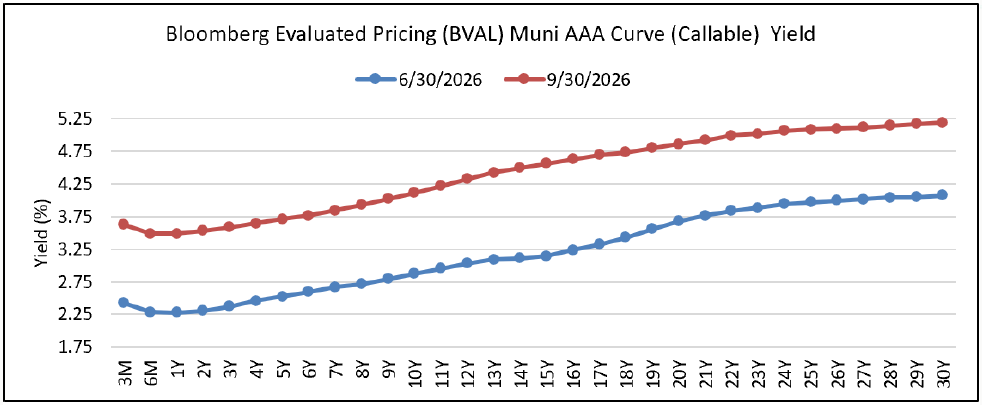
Source: Bloomberg as of 9/30/26
Past market performance is no guarantee of future results.
- Muni valuations, as measured by the muni-to-treasury ratio, cheapened (rose) in the third quarter after richening during the second quarter. As mentioned, munis saw negative investor flows in mutual funds as the quarter was ending which also coincided with a period of weaker reinvestment flows and heavy supply. As a result of munis’ underperformance relative to Treasurys, valuations now sit at their cheapest levels in over a year across the yield curve.
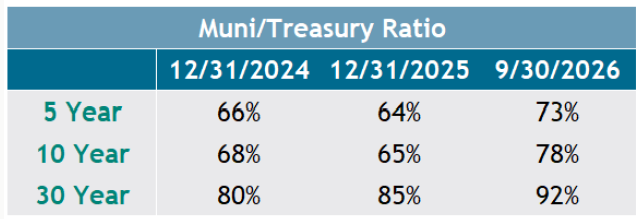
Source: Bloomberg
Returns for multi-year periods are annualized.
Past market performance is no guarantee of future results.
Muni Supply & Demand
- The flow of investor money into municipals demonstrated a positive overall trend in Q3, with weekly muni mutual fund flows remaining primarily positive and with separately managed account (SMA) and exchange traded-fund ETF demand remaining robust as well. Mutual fund net inflows totaled approximately $3-4 billion in the quarter. However, the last two weekly Mutual Fund prints turned negative, erasing more than half of the quarter’s previous inflows.
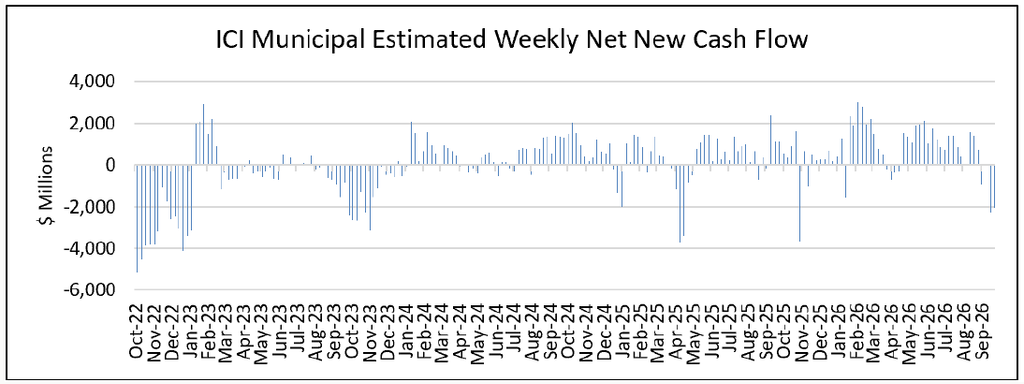
Source: Bloomberg, as of 9/30/2026.
Past market performance is no guarantee of future results.
- New muni bond supply expectations remain strong, given increased project costs and decreased federal support. New issuance of muni bonds year-to-date is running approximately 12% ahead of last year’s record pace. Summer supply was especially heavy. We expect strong new issuance to continue, albeit potentially at a slightly slower pace if rates stay elevated. New issuance continues to be fueled by inflationary effects (which increase municipal project costs) and decreased federal support for state and local entities, which drive the need for additional borrowing. However, higher yields (i.e., borrowing costs) could start to slow supply.
- From a technical perspective, seasonal flows from bond coupons and maturities entered a relatively weaker time of year in September, which should persist through the month of November. While this cycle is a known annual event and just one factor in what moves the muni market, weaker seasonals can contribute to muni market headwinds in an environment of already weakening retail demand for munis.
Outlook
The following conditions underpin our constructive outlook for the municipal market:
- Elevated absolute yields and a muni yield curve that remains steeper than in prior years offer an opportunity for appealing carry and rolldown.
- While credit conditions in several muni sectors are being impacted by Federal policy headwinds, an overall upbeat macroeconomic tone has provided stability to the credit environment.
- On a probability-adjusted basis, we forecast lower interest rates during the next year. However, we assign a 35% probability to an Economic Boom scenario, which could push rates modestly higher from current levels.
- On a “tax equivalent” basis, munis may provide a compelling alternative to other investment grade credit asset classes, particularly for high tax bracket investors.
- We expect demand from retail investors to continue supporting the market. Fund flows have been mostly stable year-to-date despite a slight pullback in September. However, as Q3 ends, we are entering a period of seasonally weaker reinvestment flows, which could present a headwind should supply remain elevated.
- Credit spreads across the curve are close to fair value in our opinion and we are not forecasting material spread tightening for the remainder of this year.
- Valuations across all tenors of the muni yield curve now sit at their cheapest levels in more than a year.
- The risks which challenge our forecasts include Federal policy headwinds that could impact the credit fundamentals of weaker quality muni issuers, the impact of inflation which could affect the extent and timing of future Fed rate decisions, and the potential for a persistently strong economy which continues to pressure long-term rates higher.
The Bloomberg Municipal Bond Index sported a 4.78% yield at quarter-end, which equates to an 8.07% Taxable Equivalent Yield (using an effective tax rate of 40.8%). We believe this represents compelling value -and a possible entry point -relative to the Bloomberg US Corporate Bond Index and the Bloomberg US Aggregate Index.
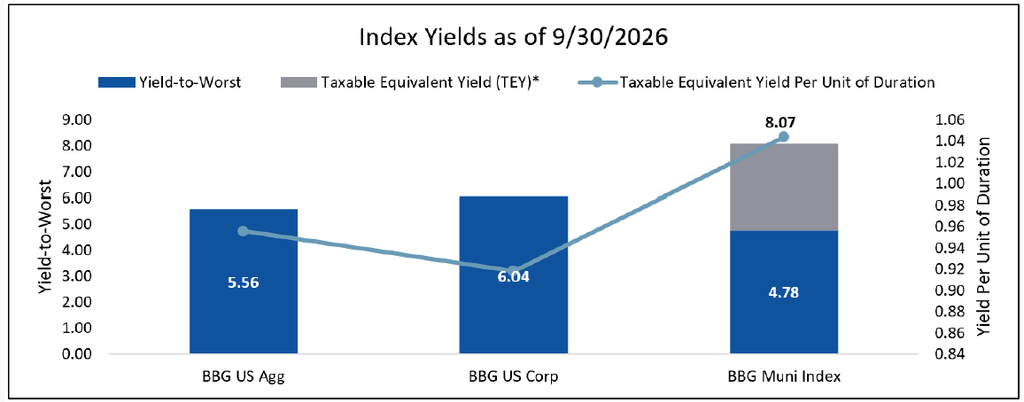
*The taxable equivalent yield is calculated using an effective tax rate of 40.8% which includes the 37.0% top federal marginal income tax rate and the 3.8% Net Investment Income Tax to fund Medicare. Source: Loomis Sayles and Bloomberg as of 9/30/2026.
Past market performance is no guarantee of future results.
IMPORTANT DISCLSOURES
Past performance is no guarantee of future results.
Market conditions are extremely fluid and change frequently.
Diversification does not ensure a profit or guarantee against a loss.
Any investment that has the possibility for profits also as the possibility of losses, including the loss of principal.
This material is not intended to provide tax, legal, insurance, or investment advice. Please seek appropriate professional expertise for your needs.
Indices are unmanaged and do not incur fees. It is not possible to invest directly in an index.
This marketing communication is provided for informational purposes only and should not be construed as investment advice. Any opinions or forecasts contained herein, reflect the subjective judgments and assumptions of the authors only, and do not necessarily reflect the viewsof Loomis, Sayles & Company, L.P. Investment recommendations may be inconsistent with these opinions. There is no assurance that developments will transpire as forecasted and actual results will be different. Data and analysis does not represent the actual, orexpected future performance of any investment product. Information, including that obtained from outside sources, is believed to be correct, but we cannot guarantee its accuracy. This information is subject to change at any time without notice.
For Investment professional use only. Not for further distribution.
9158626.1.1
Meet the Team