

Emerging Market Debt: Two Truths and a Lie
Have you ever played the game “Two Truths and a Lie”? In this game, players are presented with three believable statements and must decide which one is false. Can you spot the lie among the statements below?
- Emerging markets (EM) are at the center of the AI ecosystem.
- Ballooning AI energy demand and supply security are accelerating investment in power infrastructure and alternative energy in EM.
- The energy shock has derailed EM resilience.
History Doesn’t Always Predict the Future
At first glance, number three might seem credible, but it’s false. It’s easy to assume that an energy shock would erode EM resilience. Higher energy costs have historically been a problem for many emerging economies, especially those relying on imports. However, this time around, EM governments worked fast to cushion the immediate impact. They used a variety of tools, including subsidies, energy curtailment measures, and alternative oil supplies. While the full effects from the shock may take time to emerge, current inflation and activity indicators point to resilience. Surging global AI investment has certainly helped. And we believe even some of the weaker-looking indicators deserve a second look. For instance, wider trade deficits in EM Asia associated with rising energy imports also reflect imports of capital goods and related intermediate goods that are likely tied to AI activity. We see evidence of a broader buildout in EM that should continue to support growth.
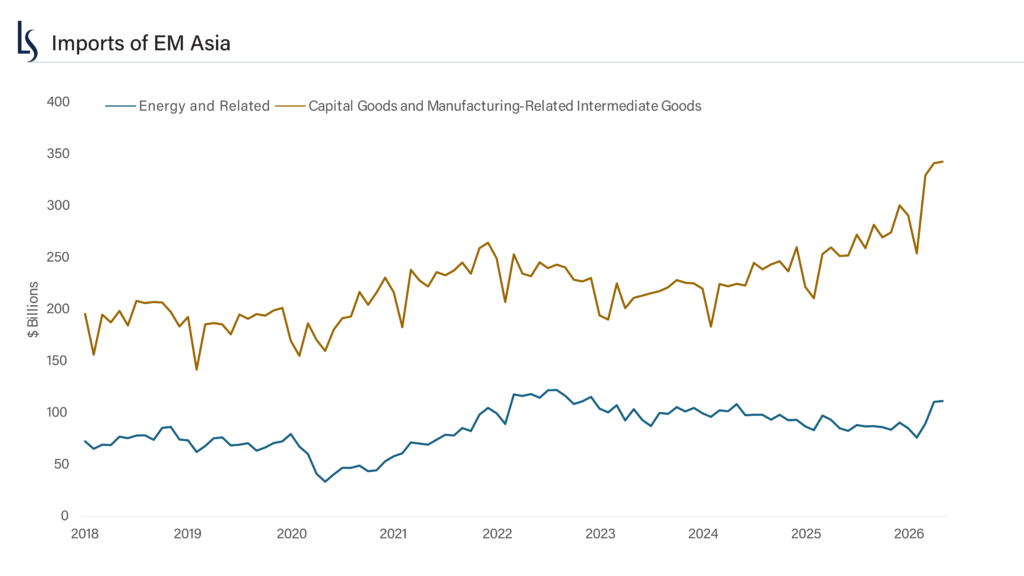
Source: CEIC, monthly data through May 2026.
Emerging Markets Sit at The Center of Two Powerful Demand Cycles: AI and Energy
Asia is the manufacturing center of the global economy. China dominates with a consistent share of global manufacturing, but other emerging Asia countries have become increasingly important suppliers. As shown in the chart below, Asia (excluding China and Japan) now accounts for close to 35% of total global manufacturing. Much ink has been spilled about the significant amount of global spending on artificial intelligence, but below is a quick overview of the role EM plays in these demand cycles.
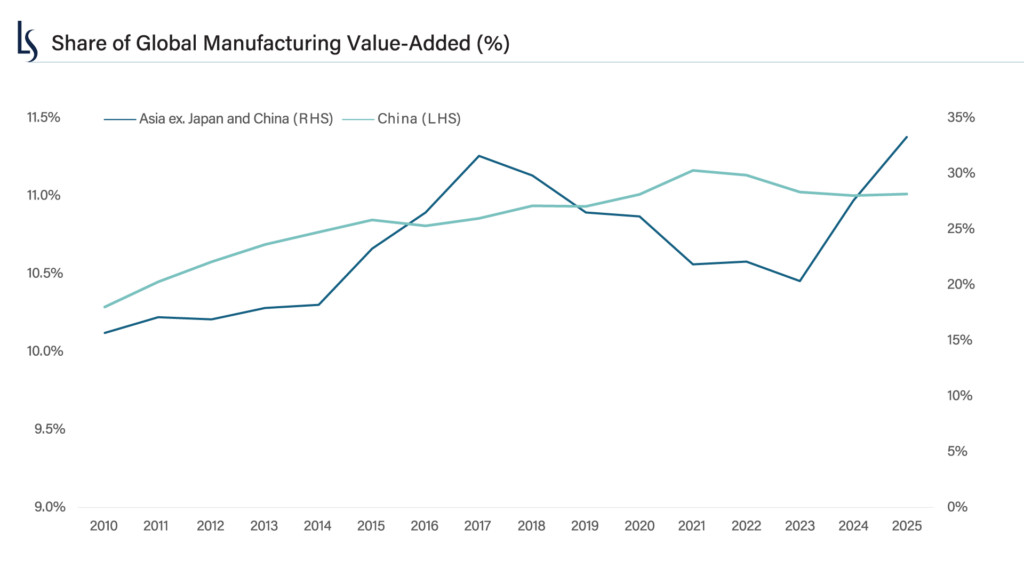
Source: Haver, as of June 30, 2026.
The AI Investment Cycle: Global spending on broadly defined AI is expected to almost double in 2026 to over $2.5 trillion, with potentially another trillion added in 2027. AI requires deep, complex supply chains. A large portion of those supply chains runs through EM, particularly in Asia, and we expect these countries to be important beneficiaries of this wave of spending. The AI supply chain includes everything from computer and data center components, to silicon wafers, electronic parts, and energy storage systems. Production is spread across China, South Korea, Taiwan, Vietnam, Malaysia, Singapore and beyond. The insatiable demand for semiconductors is visible in the export data out of South Korea and Taiwan. The Philippines plays an important role in assembly and testing, while India’s expanding design and build capabilities in the AI ecosystem are growing.
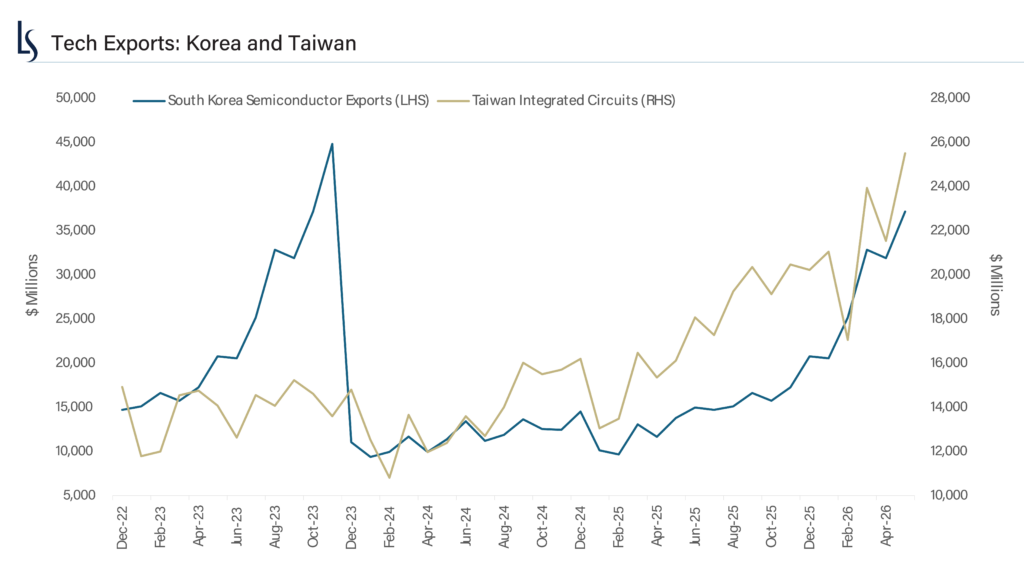
Source: Haver, as of June 30, 2026.
The Energy Investment Cycle: Growth in data centers and AI infrastructure requires significant expansion and modernization of power systems. The International Energy Agency estimates global electricity demand will accelerate in 2026-2030 to 3.6% from the 2.8% annual rate of the past 10 years, pointing to surging demand for power grid upgrades, storage capacity and more reliable transmission infrastructure.
EM countries have a central role in energy infrastructure as producers, consumers and exporters. In fact, some Asian countries with supportive government policies and early adoption of renewable technologies (electric vehicles, solar and wind power) are at the forefront of global electrification. China leads in solar and power equipment manufacturing. China and South Korea are key players in battery storage production. India is a major wind turbine maker. We believe the recent energy shock will help pull forward a multi-year investment cycle that helps countries build capacity and reduce dependence on imported energy over time. For example, China is in the midst of a five-year, $700+ billion upgrade to its power grid,i and India is diversifying its power generation mix by promoting investment in renewable and nuclear energy.
Beyond the Glitz
Nearly every layer of the AI ecosystem requires a range of metals, and EM countries are core suppliers of these critical inputs. For example, Latin American mining powerhouses Chile and Peru hold nearly one third of the world’s copper reserves.ii Indonesia is a key supplier of tin, nickel and copper, while China remains central in rare earth materials. In Africa, the Democratic Republic of the Congo is, by far, the world’s largest cobalt producer with market share estimates in the 70% range.iii In our view, these vast resource bases provide an important anchor for investment as countries look to climb the value chain.
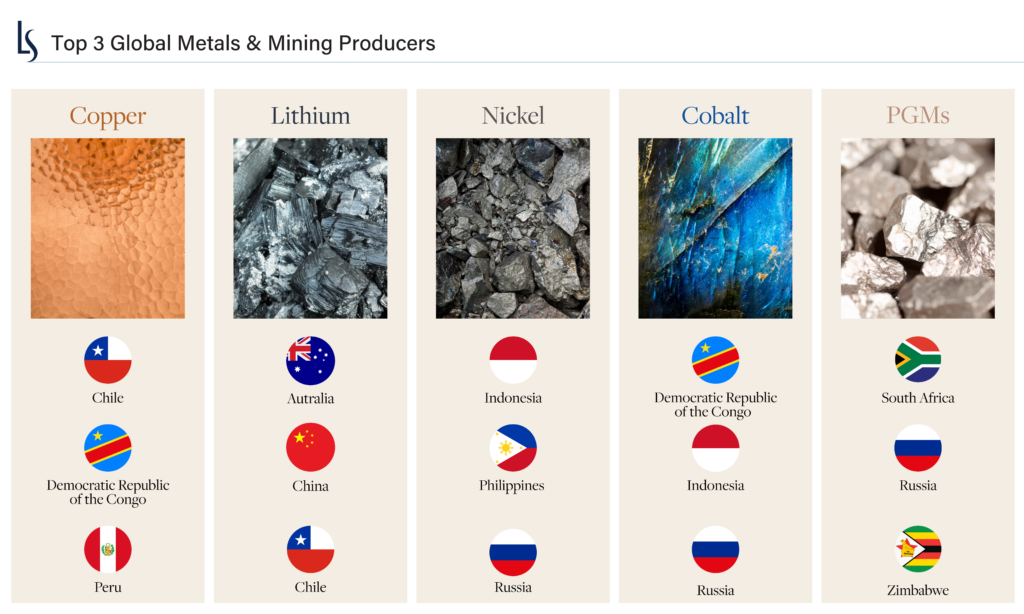
Source: Data as of 2025, based on mine production. US Geological Survey Minerals Yearbook, USGS.gov.
Resilience Anchored in Structural Reforms and Investment Tailwinds
EM entered 2026 in a stronger position than in past cycles. Though the energy shock unsettled markets, credible policymaking and effective reforms have helped anchor financial conditions across many EM economies. The surge in AI investment has helped cushion EM economies and even been a tailwind in some cases. Risks remain, including unresolved geopolitical tensions and the potential overhang of a “super” El Niño. Still, the buildout of the AI ecosystem and the need for secure energy are both deeply connected to emerging markets. We believe these tailwinds can help sustain the positive long-term growth differential between EM economies and their developed-market peers.
Endnotes
i Source: China Daily, February 10, 2026.
ii Source: Bloomberg, BI COPPG <go>, market share tab
iii Source: US Geological Survey Minerals Yearbook, USGS.gov.
Disclosure
Market conditions are extremely fluid and change frequently.
This blog post is provided for informational purposes only and should not be construed as investment advice. Any opinions or forecasts contained herein reflect the subjective judgments and assumptions of the authors only and do not necessarily reflect the views of Loomis, Sayles & Company, L.P. Information, including that obtained from outside sources, is believed to be correct, but Loomis Sayles cannot guarantee its accuracy. This material cannot be copied, reproduced or redistributed without authorization. This information is subject to change at any time without notice. Market conditions are extremely fluid and change frequently.
9059450.1.1
Authors
