Chart of the Week: Global Manufacturing Has Reached Historically High Levels
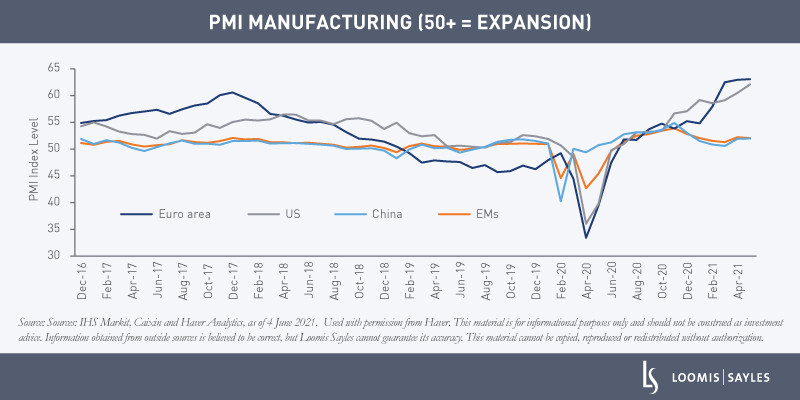
Global manufacturing appears to be roaring ahead. Global PMI[i] reached 56 in May, its highest level since 2010. What’s interesting is that emerging market (EM) and China PMIs have lagged developed markets (DM). China and Asia PMIs tend to lead DM PMIs during crisis periods, mostly due to China’s credit impulse and Asia’s prominent role in the global supply chain.
If EM PMIs are running lower than DM, does that suggest DM PMIs may run out of steam soon?
We don’t think so. DM PMIs may be at or near a peak, but we expect them to remain at elevated levels as the reopening process continues. It typically takes about 12 months or more for PMI prints to go from a peak to below 50 (indicating a contraction). Sometimes, it can take years. Meanwhile, EM PMIs are likely to catch up as vaccine distribution becomes more widespread, leading to more synchronous global growth.
For more on what growth dynamics may mean for the credit cycle, visit the Macro Strategies landing page.

WRITTEN BY:


[i] Purchasing Managers’ Index™ (PMI™) data are compiled by IHS Markit for more than 40 economies worldwide. It is often used to gauge the overall health of an economy. PMI levels above 50 indicate expansion.
MALR27357


