
Assessing El Niño’s Uneven Impact on EM Sovereigns
We see a high likelihood that the current “Super” El Niño will be the strongest on record, with significant implications for economies around the globe. This recurring climate phenomenon typically hits inflation, growth and government budgets as it disrupts agricultural and climate-sensitive sectors like mining and utilities. Here, we’ll focus on emerging market (EM) sovereign economies and unpack what a Super El Niño could mean for their risk-adjusted relative value.
What is El Niño?
El Niño is a regularly occurring, global climate event. Put simply, it arises when the southern Pacific Ocean is warmer than usual, resulting in extreme outcomes for temperature and precipitation globally.
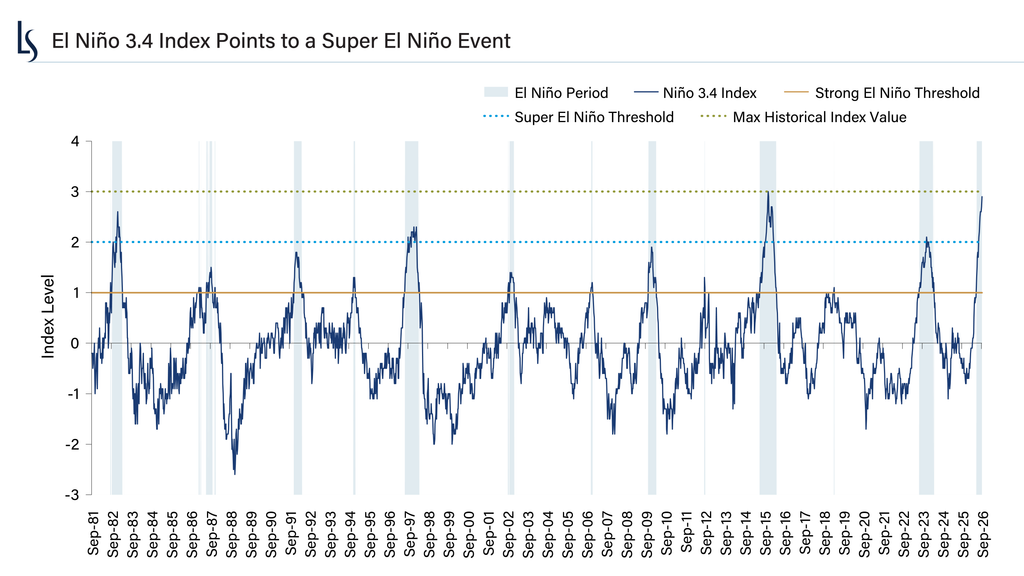
Source: NOAA (National Oceanic and Atmospheric Administration), Bloomberg, as of September 9, 2026.
El Niño Has Historically Acted as a Risk Amplifier
El Niño’s climate impacts tend to be highly uneven across regions and sometimes even within countries. The effects can range from dry weather in Southeast Asia to more precipitation in parts of Latin America. The economic transmission channels are more defined. There are generally three primary channels of economic impact from El Niño:
- Gross Domestic Product (GDP), particularly through weaker growth in climate-sensitive sectors such as agriculture, livestock, mining and utilities.
- Inflation, via weaker output, supply disruptions and commodity price spillovers.
- Fiscal balances, reflecting weaker tax revenues alongside higher social spending and public infrastructure repairs.
We think Peru’s experience during the 2015-2016 Super El Niño is a useful case study. While the country avoided a recession during this period, its primary fiscal balance swung from surplus to deficit and didn’t recover for three years. Inflation and growth outcomes were worse than expected based on historical norms. It’s worth noting that much of this fiscal deterioration coincided with a broader decline in metals prices during the period, making it difficult to isolate the fiscal impact of El Niño. Furthermore, despite these pressures, Peruvian sovereign spreads did not meaningfully widen relative to the broader J.P. Morgan Emerging Markets Bond Index.
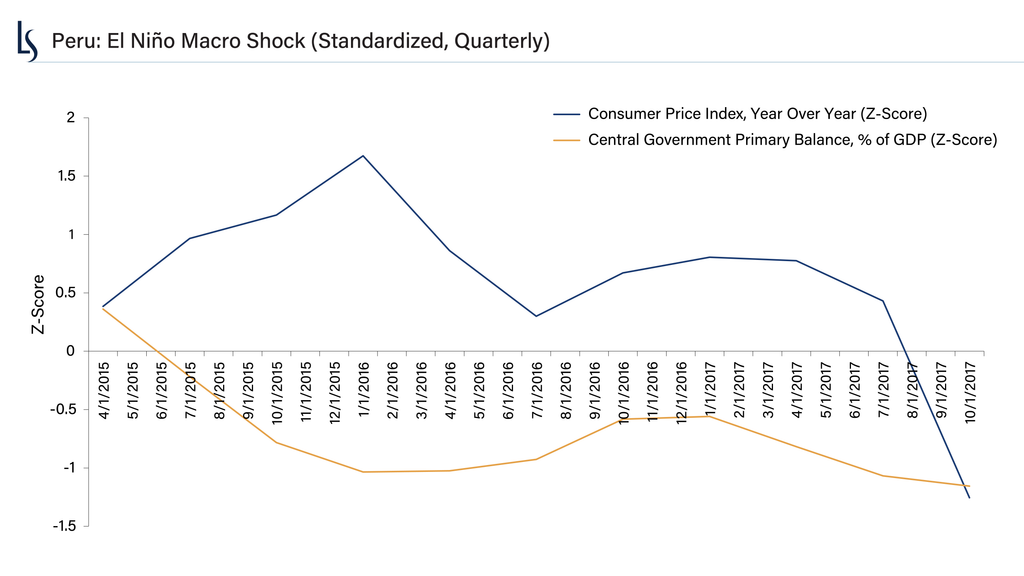
Z-scores calculated using monthly data from March 2013 to December 2019.
Source: Haver Analytics, Central Reserve Bank of Peru, Loomis Sayles, data pulled on May 21, 2026.
Which Sovereigns May Be Exposed?
As we considered the potential effects of El Niño, we asked ourselves: which sovereigns face the greatest economic risk? We used a proprietary tool called PHIRE™ (Physical Hazard Investment Risk Exposure) to seek out the answers. PHIRE combines measures of hazard exposure with economic, infrastructural and institutional factors to assess sovereign exposure and resilience to physical climate risks.
The tool provided intuitive but instructive results. India appears most vulnerable as drier, hotter conditions collide with a weak monsoon forecast. Compounding this is the country’s reliance on the Strait of Hormuz for fertilizer imports. While we believe India’s agricultural sector may face elevated climate and supply risks, the country’s broader economy continues to demonstrate strong momentum, with GDP growth of 7.8% in the second quarter of 2026.i Indonesia faces similar climate pressures to India.
South America looks better positioned for climate risks. While Peru cannot escape El Niño due to its particular geography and economic structure, we believe its vulnerability is lower than in the past cycle due to intentional preparations and strong macro buffers, notably the copper boom that has benefited external and fiscal balances. Peru, Chile, Uruguay and Costa Rica scored well due to resilience factors such as infrastructure quality, preparedness, access to catastrophe funding and broader macro-financial resilience. Other economies in the region, including Argentina, Paraguay and southern Brazil, have historically benefited from El Niño conditions rather than suffered from them.
Have Markets Priced These Risks In?
From there, the next question was whether markets have already priced in these risks. To answer this, we combined PHIRE output with our proprietary EM valuation tool. We found that sovereigns fell into three groups:
- Rich and risky: These sovereigns have high physical risk exposure paired with tight spreads, suggesting investors may not be compensated for the risk. South and southeast Asia dominate this group, including Sri Lanka and Indonesia.
- Cheaper and climate-resilient: These sovereigns are less exposed to physical risk and offer more attractive valuations in our view. This group includes Argentina, Ecuador, Mexico and South Africa.
- El Niño hideouts: We believe this group of sovereigns is largely insulated from the effects of El Niño altogether, and is concentrated in Sub-Saharan Africa, Central and Eastern Europe and Central Asia. Many of these appear to have attractive valuations, so investors may not have to sacrifice yield for the insulation.
Weathering the Storm
Within the highly differentiated EM sovereign landscape, we believe the potential economic impact of El Niño, and the degree to which markets have priced it in, varies meaningfully by country. The phenomenon is not a uniform drag on EM. Our analysis suggests some of the most exposed sovereigns are also the most expensive. We believe investors concerned about El Niño risk should assess exposure country by country, looking for sovereigns that demonstrate both attractive valuations and climate resilience.
Endnote
i Source: National Accounts Division, National Statistics Office, MoSPI, Government of India. FY 2026-27 (April-June) data, released August 31, 2026.
Disclosure
Market conditions are extremely fluid and change frequently.
This marketing communication is provided for informational purposes only and should not be construed as investment advice. Any opinions or forecasts contained herein reflect the subjective judgments and assumptions of the authors only, and do not necessarily reflect the views of Loomis, Sayles & Company, L.P. Investment recommendations may be inconsistent with these opinions. There is no assurance that developments will transpire as forecasted and actual results will be different. Diversification does not ensure a profit or guarantee against a loss. This material should not be considered a solicitation to buy or an offer to sell any product or service to any person in any jurisdiction where such activity would be unlawful. Data and analysis do not represent the actual or expected future performance of any investment product. Information, including that obtained from outside sources, is believed to be correct, but Loomis Sayles cannot guarantee its accuracy. This information is subject to change at any time without notice.
9136629.1.1
Author
