Blended Emerging Markets Debt: A Paradigm Shift

Think differently about emerging markets (EM) debt investing.
Instead of approaching an allocation to EM debt piecemeal, with separate portfolios allocated to sovereign or corporate issuers denominated in local or hard currency, consider the potential of a blended EM debt allocation. In our view, active management within this broader universe could best position investors seeking to capture the full diversification potential from EM.
Key Takeaways
- Employing a tactical, multi-asset approach to EM debt investing can help capitalize on different stages of market risk premium.
- Since global economic health drives EM growth and risk-adjusted returns, we believe accurately identifying economic regimes in a timely way is critical.
- Active management within a blended EM universe can seek to make the most of full country diversification potential—a possibility outside the scope of a passive ETF.
- The Loomis Sayles Emerging Markets Debt Blended Total Return strategy uses machine learning to generate top-down asset allocation signals, seeking alpha across the broadest set of EM debt opportunities.
Fundamentally, since EM economies are dependent on global demand, identifying economic regimes accurately and quickly matters.
However, economic data releases that could indicate each country’s phase of the global credit cycle tend to be lagged by one to six months. Therefore, a portfolio positioned across EM debt and managed to harvest risk premia has to identify when and where investors will potentially be compensated. We believe a quantitative, top-down macroeconomic approach should be the first step toward maximizing risk-adjusted return potential across EM debt asset classes.
The chart below hypothetically illustrates how full-year, equally weighted, blended EM debt returns tend to capture median returns across procyclical assets with the benefit of diversification and lower volatility.
A BLENDED APPROACH CAN HELP MANAGE DOWNSIDE RISK – INDEX ANNUAL TOTAL RETURNS
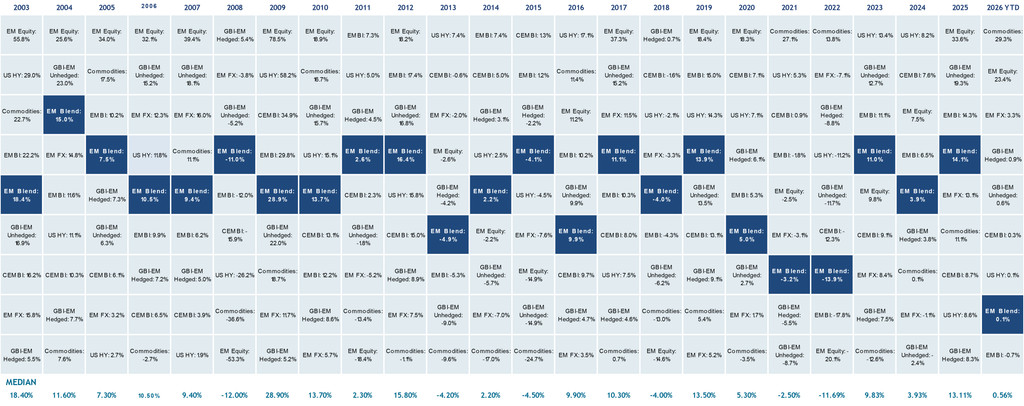
Source: Loomis Sayles, Bloomberg, JP Morgan and MSCI. Data based on calendar year returns in USD. As of September 30, 2026. EM Blend is an equal-weighted index with allocations to the three major emerging markets debt indices: JP Morgan CEMBI Broad Diversified, EMBI Global Diversified and GBI-EM Global Diversified Indices, rebalanced monthly.
See Endnotes for index names.
Past market experience is no guarantee of future results.
Opportunity Set
The rapid economic development in emerging countries continues to drive growth in their respective debt markets. Looking across the entire sector, including local- and hard-currency, sovereign and corporate debt, the universe currently represents approximately 30% of the global bond market, at around $33 trillion, compared with 2% in 2000.1
Currently, within the EM debt universe, investors have an unprecedented range of potential opportunities across more than 80 countries, offering diversification across geography, currency, industry, credit quality and maturity (represented by the indices below).
YIELD VS. VOLATILITY
Different market environments can provide different opportunities.
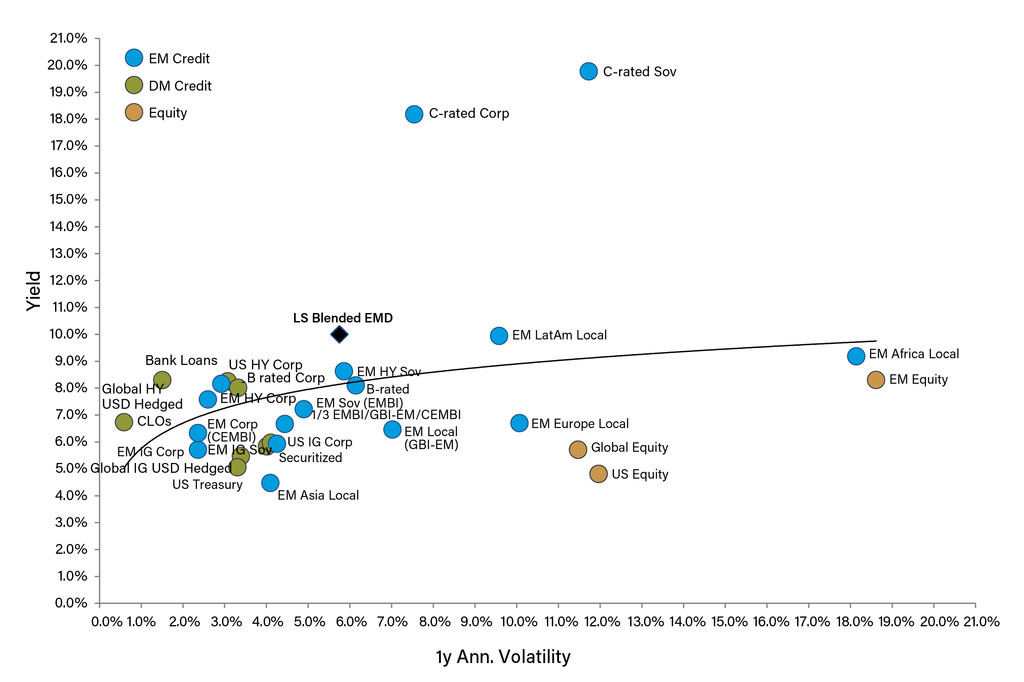
Equities Yield: Earnings Yield + 12m Dividend Yield.
Source: Loomis Sayles, JP Morgan and Bloomberg data as of September 30, 2026.
See Endnotes for index names.
Past performance is no guarantee of future results.
Approach: Active, Top-Down & Quantitative
We created the Loomis Sayles Emerging Markets Debt Blended Total Return strategy to seek alpha across the broadest set of external sovereign (hard-currency), local sovereign and corporate debt markets. In this universe, we actively employ a tactical multi-asset approach to EM debt investing to help capitalize on different stages of market risk premium.
Credit Cycles
In our view, credit cycles drive opportunities across fixed income markets. Historically, feedback loops from the major economies (financial and trade channels) have contributed volatility to EM economies (see: EM Dollar Obligations and Credit Cycles below). EM economies are typically externally dependent and driven primarily by market factors, which can lead fundamental variables by one to six months.
We structured the investment process to infer credit cycles from market data, seeking to capture risk premiums by identifying and positioning for risk-on/ risk-off regimes.
Risk Premiums
Through our research we have identified three stages of EM risk premiums. In the short term (out to three months), relative performance, exaggerated by the ebb and flow of speculative positioning, drives investor risk appetite. From three to six months, acceleration/deceleration of global growth affects corporate profits. At this point, investors tend to deploy strategic allocations, leading to crowding and return decay. In the longer term, out to 12 months, structural factors can influence productivity differentials and external imbalances, which impact ratings (see charts below). At this point, the market has largely adjusted to price in final ratings revisions.
Our analysis shows that EM debt has been in risk-on environments approximately 75% of the time. During those periods, roughly 75% of the return stream tended to be captured in the first six months of that risk-on regime, which we believe supports the importance of tactical investing based on quantitative signals versus lagged economic data.2 Our tactical approach is focused on seeking 95% of the return distribution, with a 5% to 7% volatility band, targeting a Sharpe ratio of 1.0 or higher over a full market cycle.
EM MARKET RISK PREMIUM
% OF PERIODS RISK-ON VS. RISK-OFF
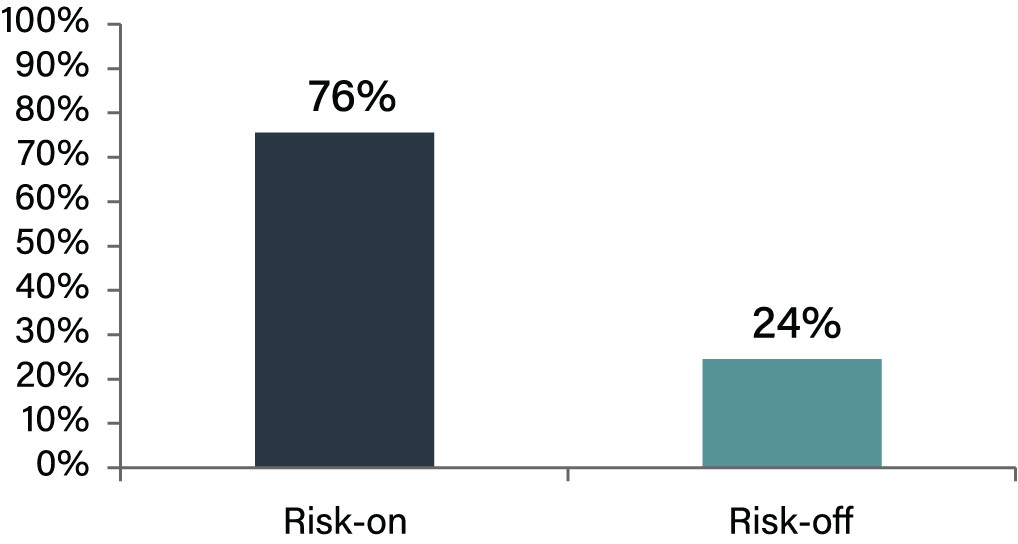
Source: Loomis Sayles as of September 30, 2026. Analysis for both exhibits based on 1,269 weekly observations.
We observed that the average risk-on period was 17 weeks and the average risk-off period was 4 weeks.
EM MARKET RISK PREMIUM
% CONTRIBUTION TO TOTAL RETURN DURING RISK-ON PERIODS
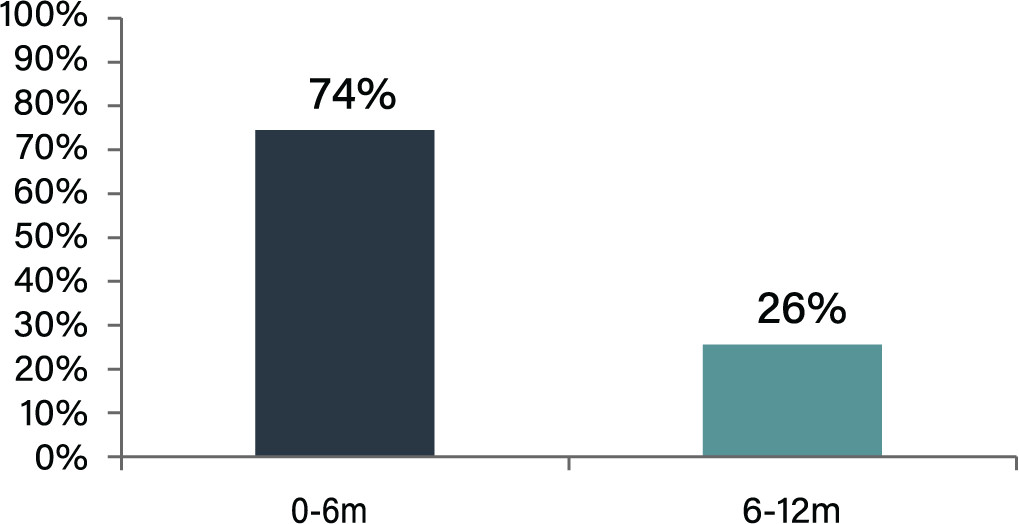
Source: Loomis Sayles as of September 30, 2026. Analysis for both exhibits based on 1,269 weekly observations.
Analysis includes only risk-on signals triggered for duration of at least six months [to isolate true bull market episodes].
A Key Differentiator: Top-Down Regime Identification
Our investment process is a key differentiator. Many existing blended EM debt strategies follow a valuation-driven, bottom-up approach to portfolio construction, often taking on more volatility and drawdown risk as a result. We believe that emerging markets move through their credit cycles much faster than developed markets. This can contribute to higher volatility in risk-off periods as crowded positions become more susceptible to sudden sell-offs. To navigate these higher-frequency cycles, we start with a top-down evaluation of the macroeconomic framework, classifying credit and foreign exchange (FX) regimes to generate asset allocation signals.
“We believe that emerging markets move through their credit cycles much faster than developed markets.”
As we have discussed, we seek to identify risk-on and risk-off regimes to guide our active asset allocation decisions across EM debt asset classes. The illustrative asset allocation table below represents multi-asset EM debt portfolios, optimized by the top-down credit and FX regime. To arrive at target allocations, the team begins by using machine learning techniques to help identify independent sources of macroeconomic risks. These can be linked to economic fundamentals (value signal within regime classification), complemented by a momentum signal to increase accuracy (because valuation is not a good timing tool). The value and momentum signals are combined to derive what we define as risk-on and risk-off regimes, which inform our top-down asset allocation. The bottom-up process then determines potential relative value opportunities by performing fundamental sovereign and corporate credit analysis, suggesting a best-ideas portfolio for a given regime.
TOP-DOWN ASSET ALLOCATION FRAMEWORK DRIVEN BY CREDIT & FX REGIMES
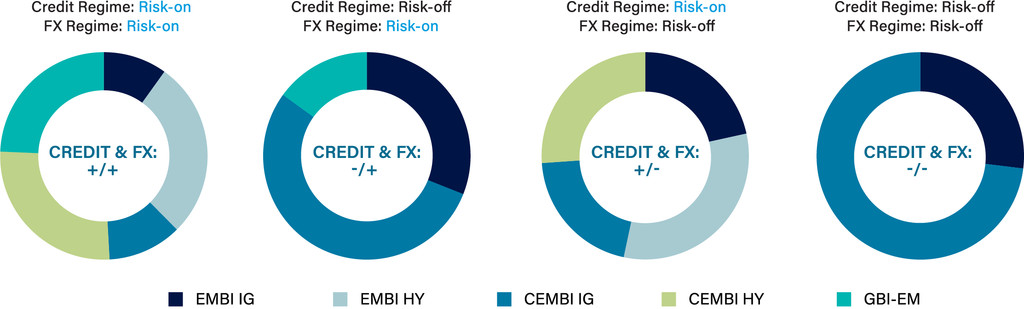
Source: Loomis Sayles and JP Morgan, as of September 30, 2026. For illustrative purposes only. See Endnotes for index names.
EM Dollar Obligations and Credit Cycles
A key challenge for EM central bankers is not just attaining full employment and price stability domestically. As IMF economist Gita Gopinath has written,
“…most emerging market economies, excluding those in the European Union (EU), have dollar export invoicing shares above 80 percent. Those in the EU rely heavily on the euro. This empirical finding implies that we need to go beyond the standard assumption of producer currency pricing, where prices are sticky in the EM exporter’s currency. Instead, we should consider a dominant currency pricing paradigm where export prices are sticky in a dominant currency, which is most often the dollar and in some cases the euro.” — Gita Gopinath. A Case for an Integrated Policy Framework, August 24, 2019.
The challenge becomes even greater when financial markets are imperfect, as we observed during the COVID-19 crisis. In such times of market stress, capital flows tend to become less mobile within the international financial system, which is dominated by the dollar. In times of acute stress, when global financial conditions abruptly tighten, twin-deficit countries (budget and current account) are most at risk (e.g., South Africa, Turkey, Brazil). These countries are reliant on external markets for funding dollar liabilities and for trade export revenues. When financial conditions tighten, sovereigns that tend to run larger deficits become fiscally and externally distressed. We believe avoiding externally distressed countries when top-down regimes turn from risk-on to risk-off—at the extremes of the return distribution—is paramount to managing downside risk.
“The challenge becomes even greater when financial markets are imperfect, as we observed during the COVID-19 crisis. In such times of market stress, capital flows tend to become less mobile within the international financial system, which is dominated by the dollar.”
Why Quantitative?
We do not believe financial markets are truly a “random walk,” or entirely unpredictable, as some academics argue—though markets can have elements of randomness (much like the weather). A probability distribution could capture future prices as well as any other stochastic process, which is why we believe our mathematical representation discussed below is a valuable input. The probability distribution of returns presents us with a range of potential outcomes—a framework to guide active asset allocation decisions.
Our approach is based on the notion that financial markets share characteristics with Markov chains: sequences of events in which the next event is only dependent on the current state. In a Markov chain, each step along the way is impossible to predict with certainty, but future steps can be predicted with some degree of accuracy if one relies on a capable model.
“We do not believe financial markets are truly a random walk.”
Stochastic equations are the broader family of equations to which Markov chains belong. Stochastic equations model dynamic processes that evolve over time and can involve a high level of uncertainty. For example, weather forecasting models use stochastic equations to generate reasonably accurate estimates. Markets are complicated and evolving with behavior that is difficult to predict over longer horizons (much like the weather). Therefore, because EM economies are externally dependent and external market conditions are typically uncertain, trading models based on stochastic equations can be valuable tools for active EM investing.
In financial markets, the name of the game is not to always be right, but to strive to be right often enough. We believe it is important to focus on avoiding externally distressed countries when the regime turns against you. By attempting to extract regime information from the market, in an effort to reduce exposure to crowding and decay, we seek to reduce dependence on lagged economic data and adapt exposures as market conditions evolve, with the goal of managing downside risk.
Elements of Our Quantitative Approach
We use machine learning techniques to search for relationships between market variables and EM returns in large datasets. Our proprietary forecasting model is capable of detecting market patterns by:
- identifying instances in the past that represent similar trading environments to today;
- examining how EM prices reacted to random market variables in those similar trading environments; and
- tracking what subsequently happened to EM prices.
We leverage this information, as it reflects today’s trading environment, to help determine where EM markets currently fall within the return distribution. At this point, artificial intelligence helps us position for a range of potential return outcomes. We run non-linear regressions to identify which market variables hold the most explanatory EM power, given the trading environment, and map those selected variables to a composite, which is mean reverting within the return distribution. We seek to identify and capture market value by employing a tail-risk mitigation concept from probability theory: the fat belly of a return distribution curve represents events that are most likely to occur (95% of observations fall within two standard deviations of the mean) while the skinny tail ends indicate those that are possible but infrequent, such as a collapse in financial markets.
EMD HISTOGRAM
Seeking to capture 95% of EM debt return distribution and minimize tail risks.
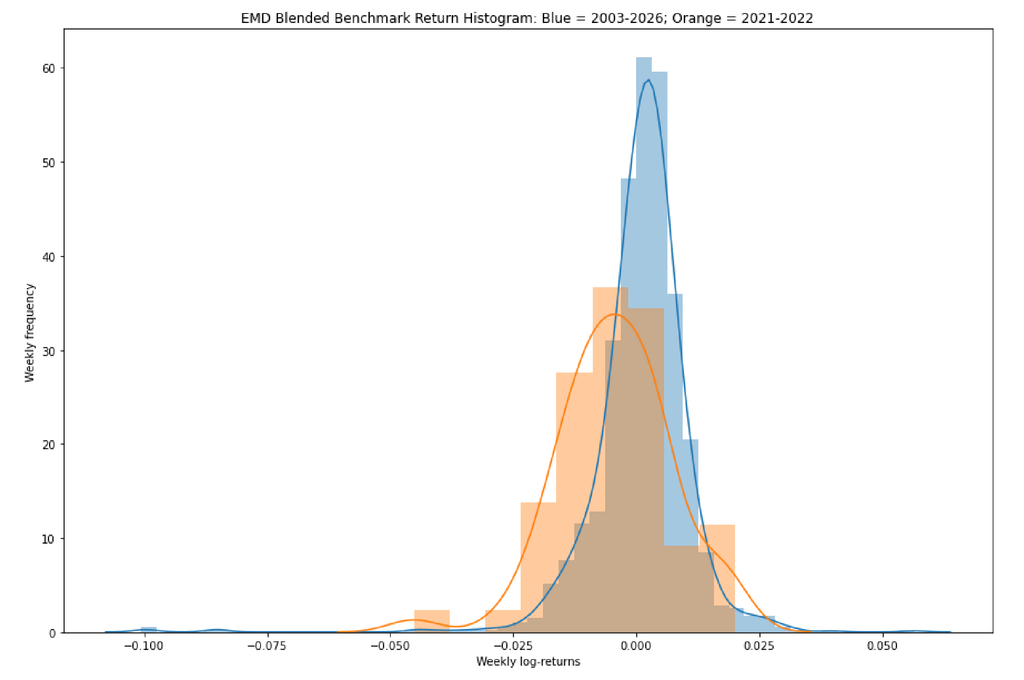
Source: Loomis Sayles and JP Morgan. Data as of September 30, 2026.
The example shows the EM Blended Benchmark (1/3 JPM EMBI, 1/3 JPM CEMBI, 1/3 JPM GBI-EM) over a full market cycle (highlighted in blue) between January 2003 and September 2026 and during market stress between 2021 and 2022. See Endnote for full index names. Note: Histogram uses a kernel density estimation (KDE) to smooth frequencies over the bins. This yields a smoother probability density function, which in general more accurately reflects the distribution of returns.
Based on our research, valuation is not a good timing tool in isolation. Incorporating momentum signals to identify and position for top-down risk-on/risk-off regimes helps focus our attempt to capture 95% of the return distribution.
Three Points to Remember Regarding Blended EM Debt
We believe the Loomis Sayles Emerging Markets Debt Blended Total Return strategy offers investors a differentiated approach to EM debt investing. First, we are seeking to capitalize on different stages of market risk premium, where typically the majority of return potential tends to be realized within six months of entry. Second, our tactical approach actively allocates across a broad EM debt universe based on our quantitatively driven top-down regime identification. Lastly, we leverage our bottom-up research and trading expertise to optimize regional exposures and security selection. Our dynamic allocation process—based on machine learning and active management—is structured to minimize the effects of crowding and decay.
Endnotes
1 Source: JP Morgan, data as of September 30, 2026.
2 Source: Loomis Sayles, January 3, 2003–September 30, 2026.
Developed Markets and Global Indices: Securitized (Bloomberg US Securitized: MBS, ABS, and CMBS Index); US Treasury (Bloomberg US Treasury Index); Global IG USD Hedged (Bloomberg Global Aggregate Corporate Index Hedged USD); US IG Corp (Bloomberg US Corporate Investment Grade Index); Bank Loans (Morningstar LSTA US Leveraged Loan Index); US HY Corp (US HY) (Bloomberg US Corporate High Yield Index); Global HY USD Hedged (Bloomberg Global High Yield Index Hedged USD); CLOs (JP Morgan Collateralized Loan Obligation Index (CLOIE)). Emerging Markets Indices: EM IG Corp (CEMBI IG) (JP Morgan CEMBI Broad Diversified Investment Grade Index); EM Asia Local (JP Morgan GBI-EM Global Diversified Asia Index); EM Corp (CEMBI) (JP Morgan CEMBI Broad Diversified Index); EM IG Sov (EMBI IG) (JP Morgan EMBI Global Diversified Investment Grade Index); EM Local (GBI-EM Unhedged) (JP Morgan GBI-EM Global Diversified Index); GBI-EM Hedged (JP Morgan GBI-EM Global Diversified Index Hedged USD); EM Europe Local (JP Morgan GBI-EM Global Diversified Europe Index); EM Sov (EMBI) (JP Morgan EMBI Global Diversified Index); EM LatAm Local (JP Morgan GBI-EM Global Diversified Latin America Index); EM HY Sov (EMBI HY) (JP Morgan EMBI Global Diversified High Yield Index); EM Africa Local (JP Morgan GBI-EM Global Diversified Mideast/Africa Index); EM HY Corp (CEMBI HY) (JP Morgan CEMBI Broad Diversified High Yield Index); B-rated Sov (JP Morgan EMBI Global Diversified B-Rated Index); C-rated Sov (JP Morgan EMBI Global Diversified C-Rated Index); B-rated Corp (JP Morgan CEMBI Broad Diversified B-Rated Index); C-rated Corp (JP Morgan CEMBI Broad Diversified C-Rated Index); EM FX (JP Morgan Emerging Local Markets Index Plus (ELMI+)). Equity and Commodity Indices: Global Equity (MSCI World Index); EM Equity (MSCI Emerging Markets Index); US Equity (S&P 500 Index); Commodities (Bloomberg Commodity Index).
Disclosures
Benchmark-agnostic portfolios may deviate significantly from the benchmark. The benchmark provides guidance on risk and return expectations over a market cycle.
There is no guarantee that an investment objective will be realized or that a strategy will generate positive or excess return.
Commodity, interest and derivative trading involves substantial risk of loss.
Although the Investment Manager actively seeks to manage risk for a targeted level, there is no guarantee that the portfolios will be able to maintain their targeted risk levels.
KEY RISKS: Credit Risk, Issuer Risk, Interest Rate Risk, Liquidity Risk, Non-US Securities Risk, Currency Risk, Prepayment Risk and Extension Risk.
Any investment that has the possibility for profits also has the possibility of losses. Diversification does not ensure a profit or guarantee against a loss.
The use of hypothetical performance has inherent limitations, including the limits of using backtested performance and the inability to reflect the impact of actual trading or market and economic factors. Investments carry the possibility for loss as well as profit. This information is not intended to be representative of any investment product or strategy.
This does not represent the past performance of any Loomis Sayles strategy and is included for illustrative purposes only.
This material is provided for informational purposes only and should not be construed as investment advice. Any economic projections or forecasts contained herein reflect subjective judgments and assumptions and actual results will be different. Investment recommendations may be inconsistent with these opinions. There is no assurance that developments will transpire as forecasted. This information is subject to change at any time without notice.
LS Loomis | Sayles is a trademark of Loomis, Sayles & Company, L.P. registered in the US Patent and Trademark Office.
8867921.1.1
Authors