Author

April 2025 Investment Outlook

Potential for change and negotiation related to US fiscal policy could keep investors skeptical near term.
US economic real growth is slowing toward a trend-like level of approximately 1.75%. In contrast, growth rates in the United Kingdom and developed economies within the euro zone are flat compared to 2024—if not slightly better. While aggregate emerging market growth will likely remain high in an absolute sense, we believe, it could slip about 0.50% from nearly 5.0% in 2024. Recession seems likely to be avoided across most regions.
With the global growth backdrop in reasonable shape, corporations should be able to operate near normal, in our view. Tariffs remain a country-dependent wild card. If aggressive tariffs are put in place, a higher cost of doing business poses risks to corporate profitability. Investors may see credit and equity market valuations under pressure while waiting for clarity on trade policy.
Investment Themes
Our take on macro drivers and major asset classes at a glance.

Macroeconomic Drivers
We believe bottom-up consensus expectations for US corporate profit growth are likely to slip from the current +10% rate. Consumers and businesses are pulling back on consumption and investment in the face of tariff uncertainty, which will hit earnings to some extent.

Corporate Credit
We believe risk premiums across the corporate bond market will likely rise as markets digest tariffs and a US growth slowdown.

Government Debt & Policy
Tariffs and potential trade partner retaliation are complicating the new administration’s pro-growth agenda.

Currencies
The Federal Reserve may be on pause, but it indicated cuts are coming later this year, which appears to be taking upside pressure off the US dollar.

Global Equities
Earnings growth should support global equities in 2025, but US valuations may remain under pressure, in our view.

Potential Risks
Odds of an economic downturn in the United States do not appear very high, but they are creeping up and making investors uncomfortable.
Macroeconomic Drivers
So far this year, profit expectations have barely budged despite noisy headlines and tariff negotiations. Even if revised modestly lower, the US corporate sector is in a strong fundamental position with profit margins near all-time highs.
- We anticipate some softening in the US labor market with companies hiring at a slower pace, but unemployment should not move much above 4.3%.
- US interest rates are well off recent highs and should support domestic borrowers and the housing sector, in our view.
- Inflation has remained above target this year, but we believe that the Fed is likely to resume interest rate cuts to preserve the expansion.
- Most developed market central banks across continental Europe, Australia and New Zealand have a cutting bias versus the Bank of Japan who is likely to hike rates in 2025.
Investors face challenges as more tariffs go into effect, but the starting point for corporate health is solid.
US profit margins lead, but other markets are delivering margins near all-time highs too.
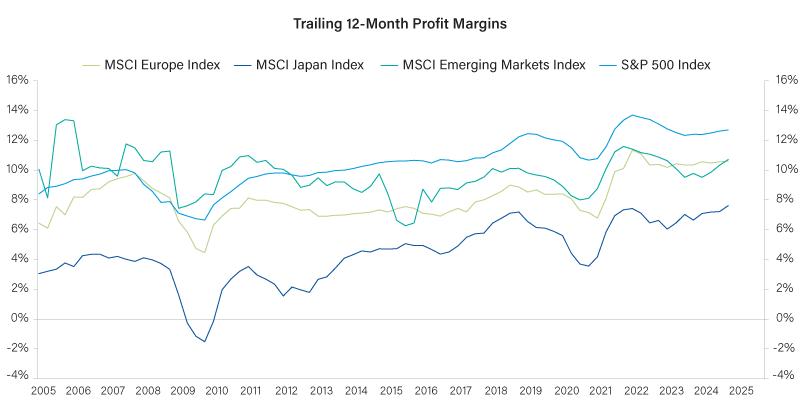
Source: MSCI, Bloomberg, as of 31 December 2024.
Neither MSCI nor any other party involved in or related to compiling, computing or creating the MSCI data makes any express or implied warranties or representations with respect to such data (or the results to be obtained by the use thereof ), and all such parties hereby expressly disclaim all warranties of originality, accuracy, completeness, merchantability or fitness for a particular purpose with respect to any of such data. Without limiting any of the foregoing, in no event shall MSCI, any of its affiliates or any third party involved in or related to compiling, computing or creating the data have any liability for any direct, indirect, special, punitive, consequential or any other damages (including lost profits) even if notified of the possibility of such damages. No further distribution or dissemination of the MSCI data is permitted without MSCI’s express written consent.
The chart presented above is shown for illustrative purposes only. Some or all of the information on this chart may be dated, and, therefore, should not be the basis to purchase or sell any securities. The information is not intended to represent any actual portfolio. Information obtained from outside sources is believed to be correct, but Loomis Sayles cannot guarantee its accuracy. This material cannot be copied, reproduced or redistributed without authorization.
Past performance is no guarantee of future results.
Corporate Credit
While credit spreads may widen from historically tight levels, spreads could compress as monetary and fiscal policy uncertainty fades.
- Based on bottom-up fundamental analysis, our Credit Research Team suggests 89% of Bloomberg US Aggregate Index industries are in the expansion phase of the credit cycle.
- Our credit analysts held positive credit outlooks for 29% of industries under their coverage, compared to 36% in December 2024.
- Our analysts’ upgraded outlooks were predominantly based on better expectations for profit margins and free cash flows.
- Our risk premium framework estimated investment grade and high yield credit losses to be near historical averages in expansion to late-cycle regimes.
- Our ranking of potential expected returns for our favored US credit markets is as follows: high yield, leveraged loans, investment grade, securitized assets and municipals.
Spread blowouts occur during economic and/or profits recessions. Neither are currently in our forecast.
Even in periods of high systemic risk, like economic downturns, sharp spikes in credit spread are often short lived.
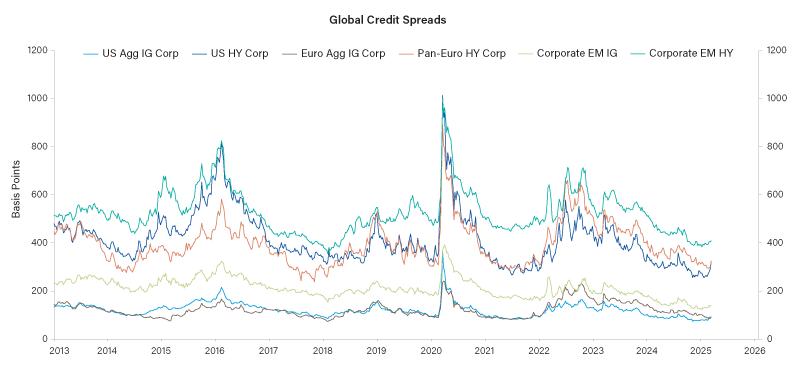
Source: Source: Bloomberg, JP Morgan, as of 14 March 2025.
The chart presented above is shown for illustrative purposes only. Some or all of the information on this chart may be dated, and, therefore, should not be the basis to purchase or sell any securities. The information is not intended to represent any actual portfolio. Information obtained from outside sources is believed to be correct, but Loomis Sayles cannot guarantee its accuracy. This material cannot be copied, reproduced or redistributed without authorization.
Indices are unmanaged. It is not possible to invest directly in an index.
Past performance is no guarantee of future results.
Government Debt & Policy
Disinflationary trends are in place, but a tariff-driven rise would slow the progress we’ve welcomed.
- Much of the downside that we anticipated in US Treasury yields in 2025 has already occurred.
- Upside risks to inflation and US long-term interest rates include increased tariffs, tax cut extensions and policy adjustments.
- We expect the Department of Government Efficiency (DOGE) to restrain spending, but are unsure the savings will decrease the US deficit.
- We believe the US administration should not prove so disruptive that it threatens the economic expansion, but equity markets are searching for that pressure point.
US Treasurys are pricing slowing growth in the US economy, while the bonds of global peers are doing the opposite.
Markets may be nearing the end of this highly dispersed outcome, but we do not expect a full reversal.
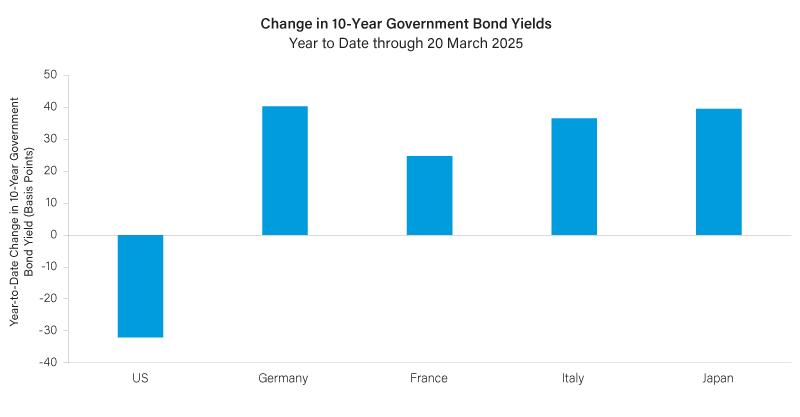
Source: Bloomberg, MSCI, as of 20 March 2025.
Neither MSCI nor any other party involved in or related to compiling, computing or creating the MSCI data makes any express or implied warranties or representations with respect to such data (or the results to be obtained by the use thereof ), and all such parties hereby expressly disclaim all warranties of originality, accuracy, completeness, merchantability or fitness for a particular purpose with respect to any of such data. Without limiting any of the foregoing, in no event shall MSCI, any of its affiliates or any third party involved in or related to compiling, computing or creating the data have any liability for any direct, indirect, special, punitive, consequential or any other damages (including lost profits) even if notified of the possibility of such damages. No further distribution or dissemination of the MSCI data is permitted without MSCI’s express written consent.
The chart presented above is shown for illustrative purposes only. Some or all of the information on this chart may be dated, and, therefore, should not be the basis to purchase or sell any securities. The information is not intended to represent any actual portfolio. Information obtained from outside sources is believed to be correct, but Loomis Sayles cannot guarantee its accuracy. This material cannot be copied, reproduced or redistributed without authorization.
Past performance is no guarantee of future results.
Currencies
Relative monetary policy and economic growth differentials, rather than market volatility, typically direct the US dollar.
- Prospects for better global growth are attracting capital into non-US assets. We believe this trend could last for several quarters or even longer.
- Often, the US dollar performs very well when systemic risks outside the US are unfavorable. We see the opposite shaping up currently.
- We are optimistic on non-US currencies owing to relative monetary policy and growth dynamics.
- Policy regime shifts, particularly in Europe and Germany, should favor higher-trend growth in future years.
- We remain cautious on China, but view upside surprises as possible this year.
Foreign currencies tend to outperform the dollar as Fed expectations get incrementally more dovish than other central banks within the Broad FX Index.
The Loomis Sayles Broad FX Index is an equally weighted basket of 23 currencies measured relative to the US dollar.
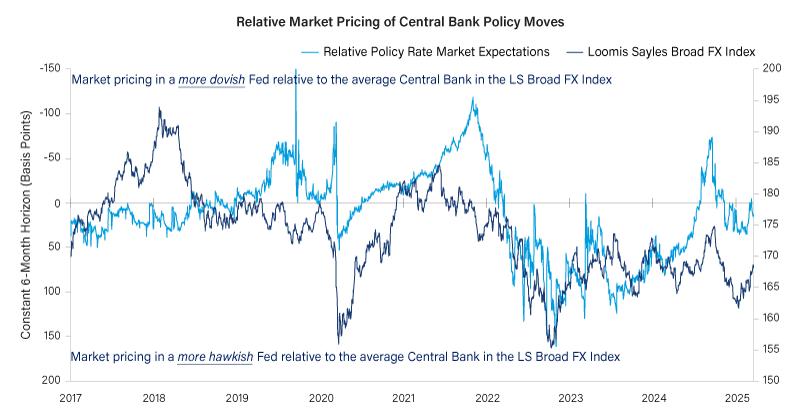
Source: Bloomberg, as of 20 March 2025.
The chart presented above is shown for illustrative purposes only. Some or all of the information on this chart may be dated, and, therefore, should not be the basis to purchase or sell any securities. The information is not intended to represent any actual portfolio. Information obtained from outside sources is believed to be correct, but Loomis Sayles cannot guarantee its accuracy. This material cannot be copied, reproduced or redistributed without authorization.
Indices are unmanaged. It is not possible to invest directly in an index.
Past performance is no guarantee of future results.
Global Equities
The macro backdrop is more challenging for equity markets, particularly after a greater-than-35% two-year run.1
- Bloomberg bottom-up consensus earnings expectations suggest the MSCI Europe should rebound from flat growth to a mid-single-digit pace in 2025. The S&P 500 Index and MSCI Emerging Markets Index are expected to grow earnings by more than 10%.
- Effective tariff rates could be nearly double our expectation of 5% in December 2025. We suspect US earnings expectations are currently too rosy.
- US equity outperformance has been significant over recent years. We think the S&P 500 Index’s forward-price-to-earnings (PE) multiple is done expanding for now. Positive total returns will depend on earnings growth.
- We believe global indices still have a chance to outperform because valuations are slightly beneath their own five-year averages.
US equities are in correction mode until more clarity on tariff magnitude and duration is established.
Non-US equities could break to new highs, and valuations do not look expensive in our view.
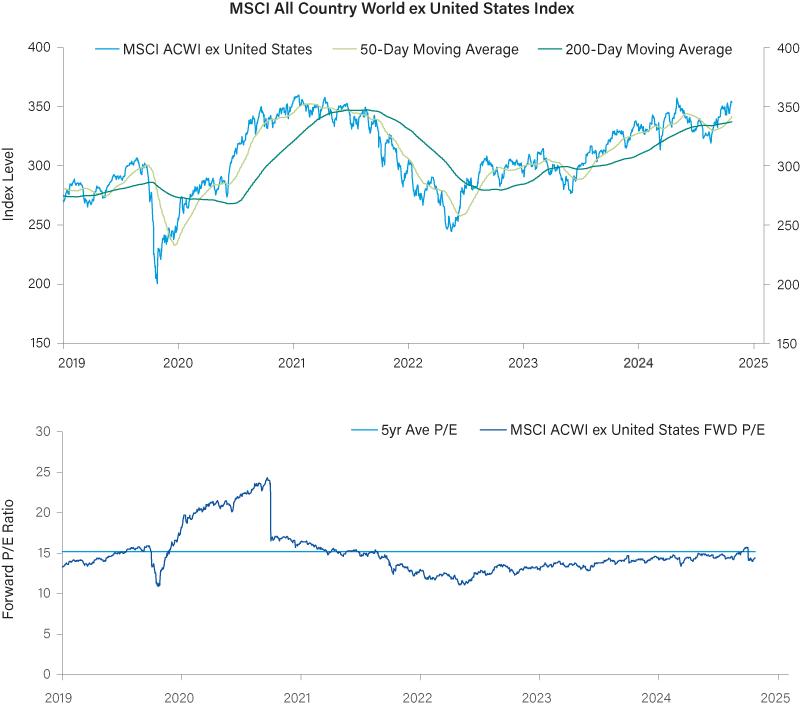
Source: Bloomberg, MSCI, as of 20 March 2025.
Neither MSCI nor any other party involved in or related to compiling, computing or creating the MSCI data makes any express or implied warranties or representations with respect to such data (or the results to be obtained by the use thereof ), and all such parties hereby expressly disclaim all warranties of originality, accuracy, completeness, merchantability or fitness for a particular purpose with respect to any of such data. Without limiting any of the foregoing, in no event shall MSCI, any of its affiliates or any third party involved in or related to compiling, computing or creating the data have any liability for any direct, indirect, special, punitive, consequential or any other damages (including lost profits) even if notified of the possibility of such damages. No further distribution or dissemination of the MSCI data is permitted without MSCI’s express written consent.
The chart presented above is shown for illustrative purposes only. Some or all of the information on this chart may be dated, and, therefore, should not be the basis to purchase or sell any securities. The information is not intended to represent any actual portfolio. Information obtained from outside sources is believed to be correct, but Loomis Sayles cannot guarantee its accuracy. This material cannot be copied, reproduced or redistributed without authorization.
Past performance is no guarantee of future results.
Potential Risks
US consumer and business sentiment is extremely negative. Perhaps we are reaching a point where attitudes can improve.
- We believe global credit and US equity markets are priced for solid economic and corporate earnings growth, which could disappoint investors.
- We believe the extent of slowing US growth and its impact on labor markets will guide already weaker risk appetites.
- Frothy consumer and business sentiment measures have sunk, but they could fall further in a global trade war.
- Stalled progress on disinflation may prevent further central bank rate cuts in 2025. At this late stage of the cycle, we believe markets and economies could benefit from lower rates.
- Investor sentiment could improve quickly if a solution is found for Russia and Ukraine while US growth only slows to long-term trend levels.
Asset Class Outlook
We see potential opportunities in non-US markets where valuations are compelling and sentiment is more muted, especially relative to the US.

Endnote
1 Source: MSCI All Country World Index.
Disclosure
This marketing communication is provided for informational purposes only and should not be construed as investment advice. Any opinions or forecasts contained herein reflect the subjective judgments and assumptions of the authors only and do not necessarily reflect the views of Loomis, Sayles & Company, L.P. Investment recommendations may be inconsistent with these opinions. There is no assurance that developments will transpire as forecasted and actual results will be different. Data and analysis do not represent the actual or expected future performance of any investment product. Information, including that obtained from outside sources, is believed to be correct, but Loomis Sayles cannot guarantee its accuracy. This information is subject to change at any time without notice. Intended for institutional investors and investment professional use only.
Diversification does not ensure a profit or guarantee against a loss.
Market conditions are extremely fluid and change frequently.
Commodity, interest and derivative trading involves substantial risk of loss.
Indices are unmanaged and do not incur fees. It is not possible to invest directly in an index.
Any investment that has the possibility for profits also has the possibility of losses, including the loss of principal.
Past performance is no guarantee of future results.
LS Loomis | Sayles is a trademark of Loomis, Sayles & Company, L.P. registered in the US Patent and Trademark Office.
SAIFazu32zlh
Author
